Bitcoin Price Analysis: Is $64K Next for BTC or is a Crash Toward $56K More Likely?

Since March, Bitcoin’s price has been consolidating in a wide range and gradually declining. This rangebound movement might eventually lead to a long-term bullish trend.
Technical Analysis
By TradingRage
The Daily Chart
On the daily chart, the price has recently broken below the 200-day moving average, located around the $63K mark.
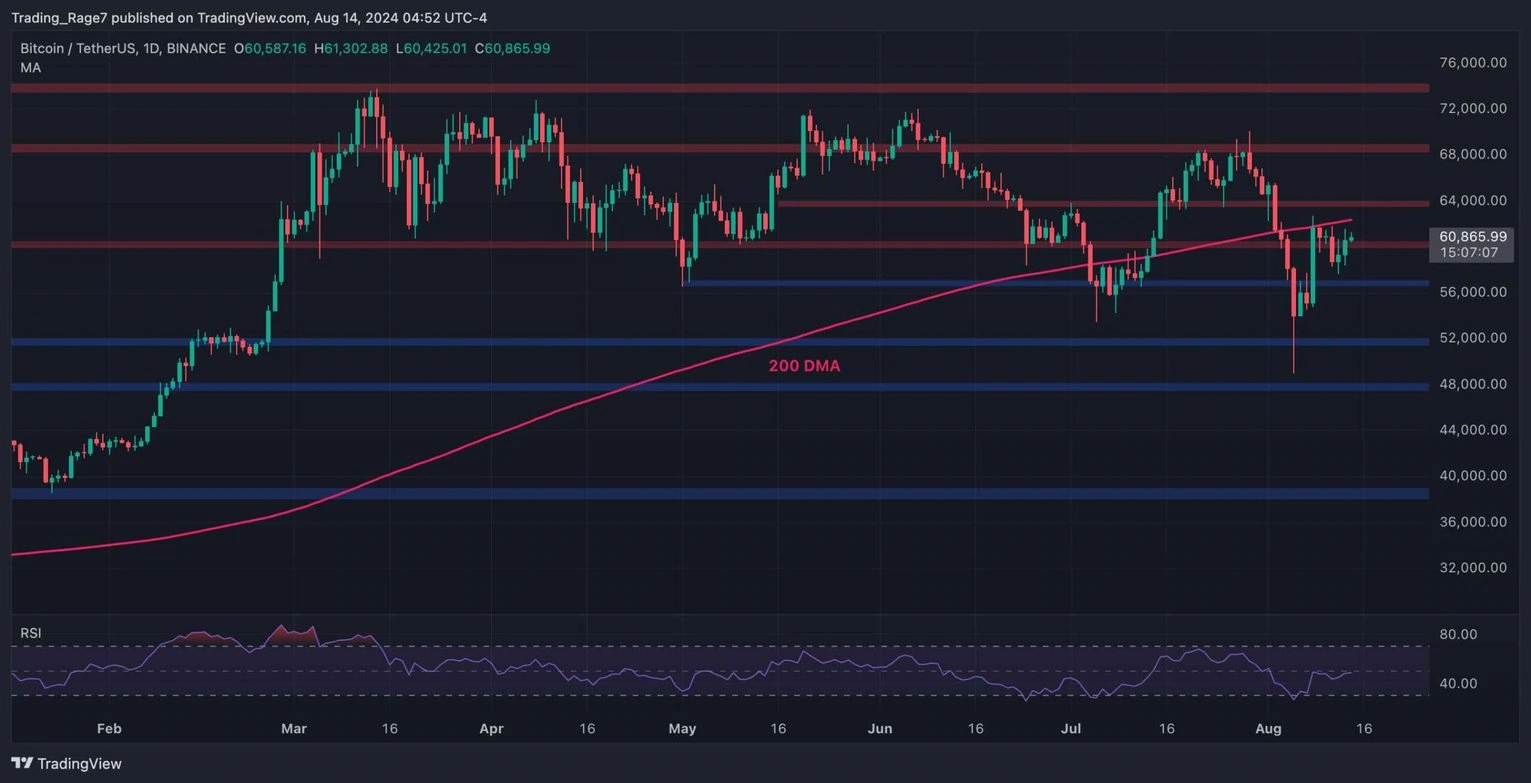
Yet, the market has rebounded from $50K and has retested the 200-day moving average but has been rejected to the downside.
Currently, the price is likely to test $56K. If the level holds, the market could once again rally toward the 200-day moving average and probably higher, which could lead to the beginning of a new bull run.
The 4-Hour Chart
The 4-hour timeframe demonstrates a possible recovery scenario, as the price has rapidly bounced higher from the $52K support level following last week’s drop.
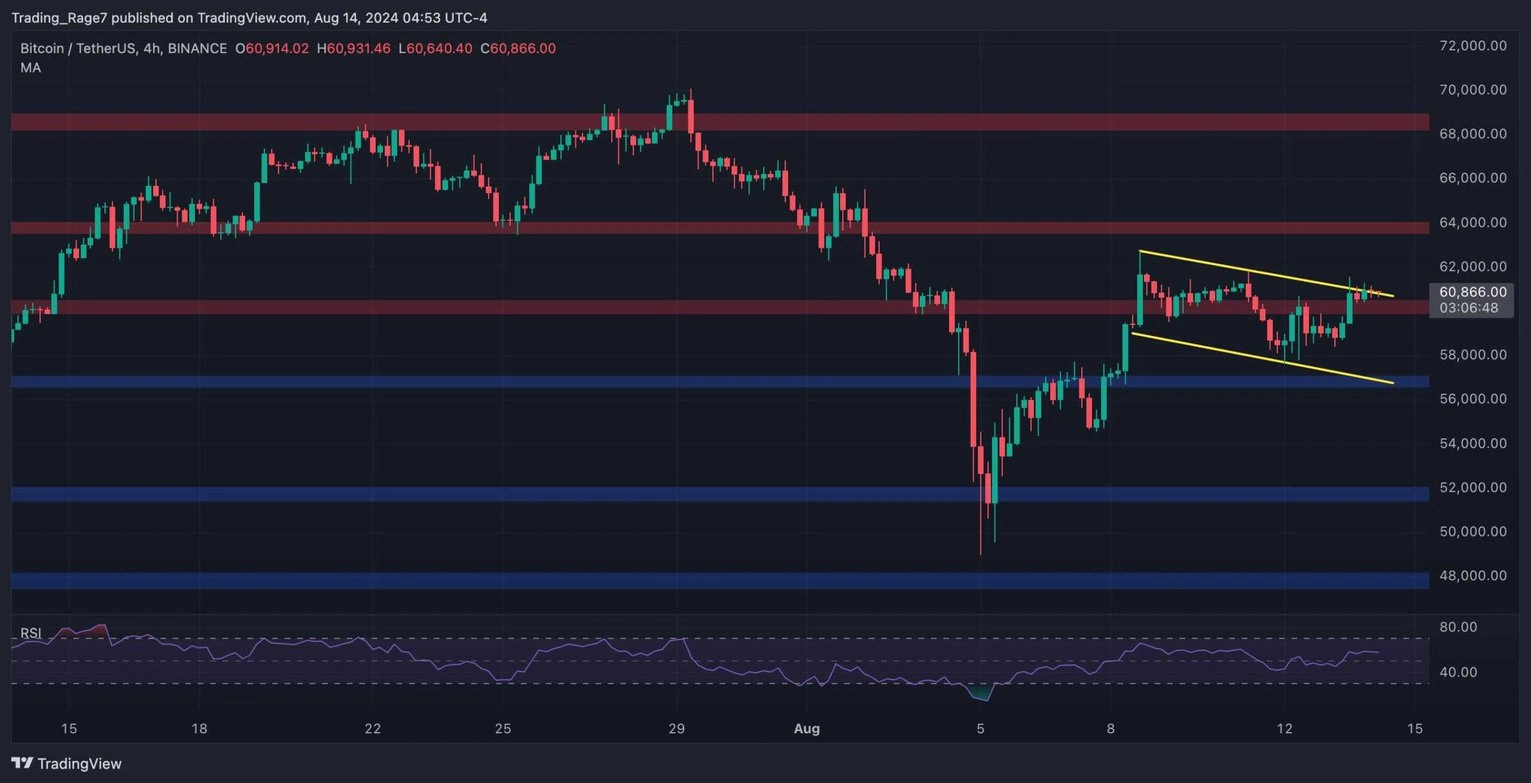
Yet, the market is struggling to break above the $61K resistance level at the moment and is creating a bullish flag pattern.
If it’s broken to the upside, an upward move toward the $64K level would be highly likely in the short term. On the other hand, if the pattern fails, things could quickly get worse, and the market could decline to the $52K level once more.
On-Chain Analysis
By TradingRage
Bitcoin Exchange Reserve
While Bitcoin’s price action is not convincing, some fundamental network metrics, due to a considerable decline in supply, are pointing to a potential price rally in the coming months.
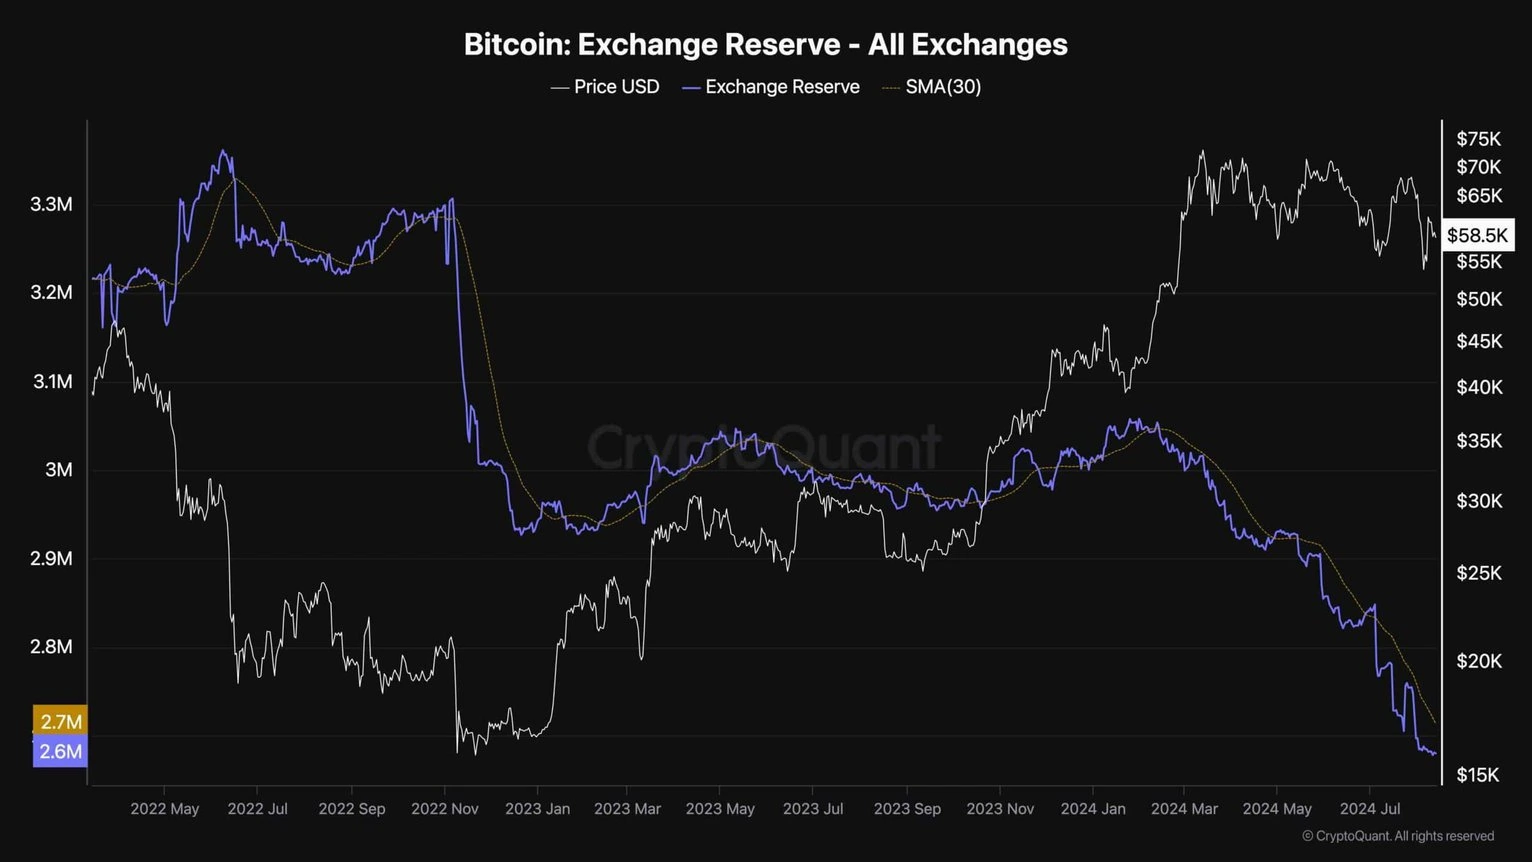
This chart displays the Bitcoin exchange reserve metric and its 30-day moving average. The metric measures the amount of BTC held in exchange wallets. The number of these coins can be considered a proxy for supply, as they are readily held on exchanges and can be sold quickly.
As the chart suggests, however, the exchange reserve metric has been on a steep decline since the beginning of 2024, indicating an aggregate accumulation behavior by investors. This is a good sign and can lead to a supply shock in the near future, which could result in a price surge for BTC.
Disclaimer: The content of this article solely reflects the author's opinion and does not represent the platform in any capacity. This article is not intended to serve as a reference for making investment decisions.
You may also like
Will WIF Make You a Millionaire in 2025?
XRP to $3? Bollinger Bands Say Maybe - But First, Major Stress Test
Solana Price Prediction: Is $200 Next for SOL After Hitting 2-month High?

Lido Says Funds Safe After Oracle Incident Triggers Emergency Response
Lido launched an emergency DAO vote to replace the compromised oracle key, with the new key already secured under enhanced protocols.