
‘Reality Check’: Top Trader Says Latest Crypto Rally May Have Been a Trap – Here’s Why

A top analyst known for calling Bitcoin ( BTC ) bottoms is warning that the rallies witnessed by the crypto markets to start the week may been a bull trap.
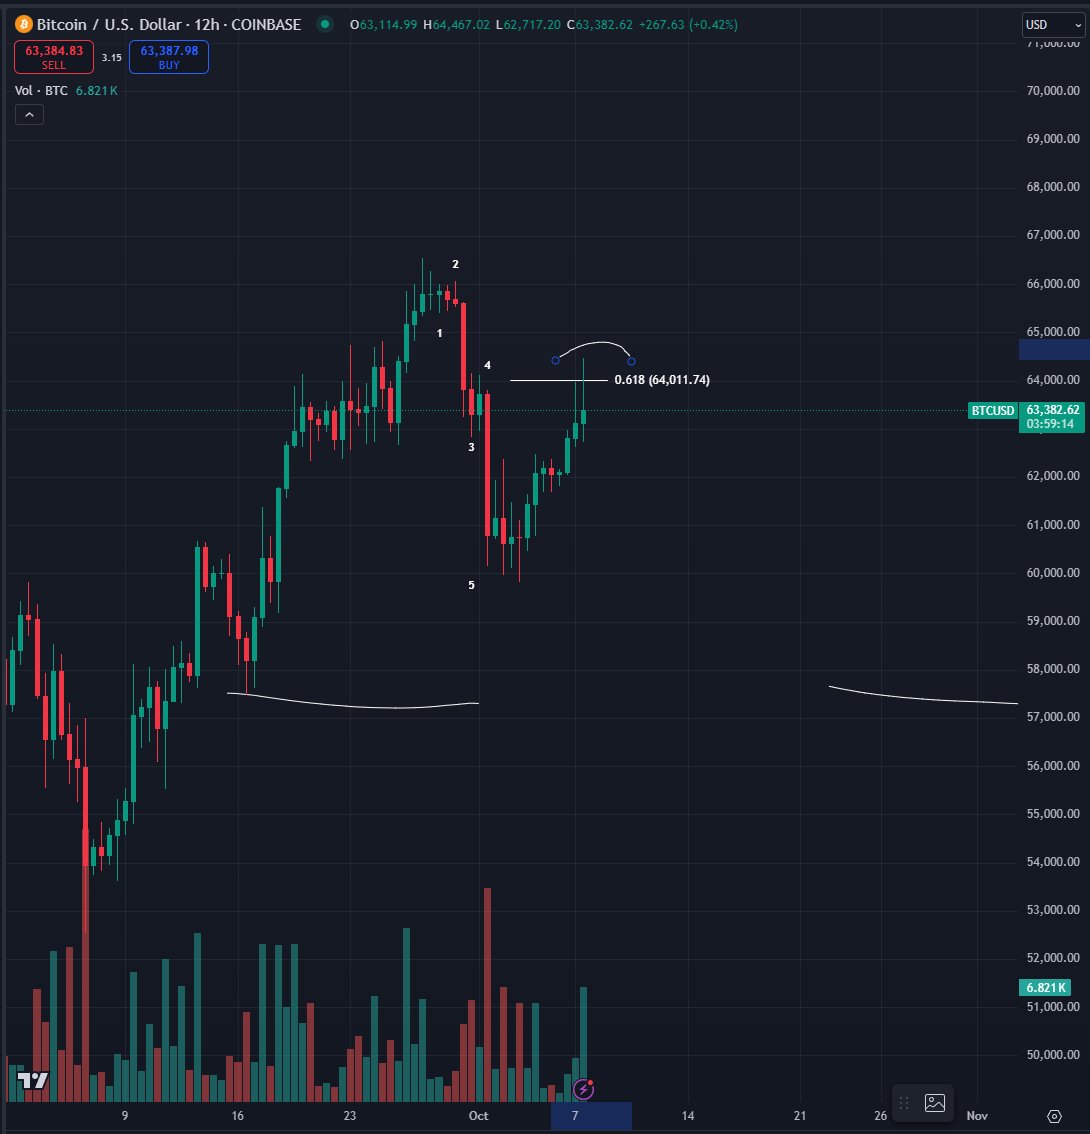
Pseudonymous analyst Bluntz tells his 279,800 followers on the social media platform X that Bitcoin looks short-term bearish after failing to rally above 0.618 Fibonacci level.
Traders use Fibonacci levels to identify potential support and resistance levels.
Says Bluntz,
“Gut is telling me these early-week crypto pumps might have been a trap.
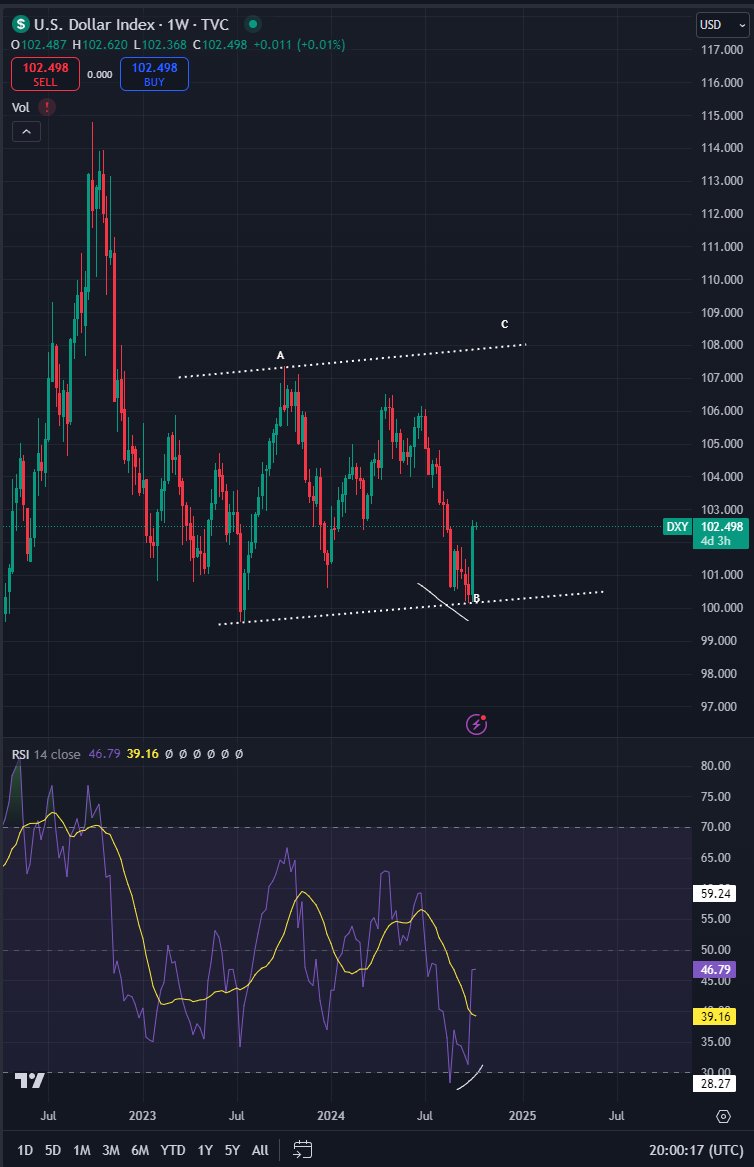
Had a good look at DXY and ES (SP 500 E-mini futures) today and gave myself a bit of a reality check.
Weekly divs on both were confirmed and BTC so far rejecting from the 0.618 Fib.”
 Source: Bluntz/X
At time of writing, Bitcoin is trading for $62,087, a fractional decrease on the day.
According to Bluntz, Bitcoin’s pullback comes as the US dollar index (DYX), which tracks the value of the US dollar against a basket of major fiat currencies, is flashing signs of strength. He shares a chart suggesting that the DXY has confirmed a bullish divergence on the weekly chart, indicating that the US dollar is poised for rallies.
 Source: Bluntz/X
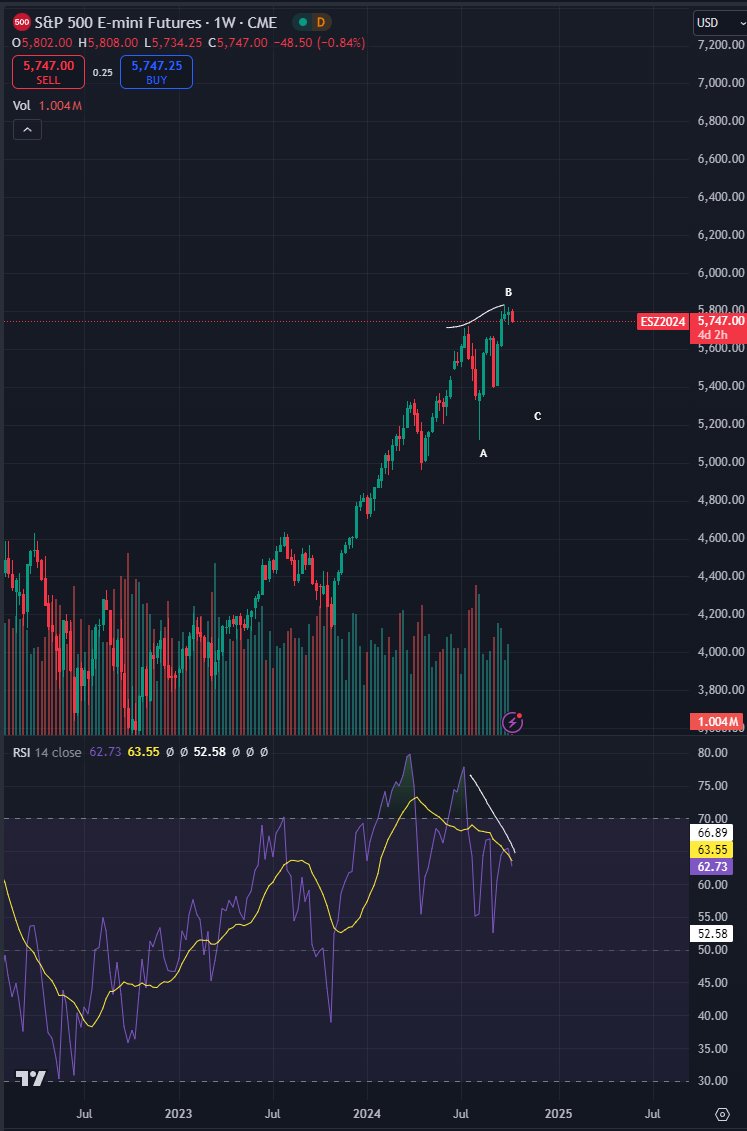
Meanwhile, Bluntz says the SP 500 is printing a bearish divergence – a potential reversal signal.
 Source: Bluntz/X
The DXY has historically been inversely correlated with the movements of risk assets. When the DXY is strong, it suggests that investors are unloading assets such as Bitcoin and stocks in favor of the US dollar.
At time of writing, the DYX is hovering at 102 points while the SP 500 is trading at 5,751.
Don't Miss a Beat – Subscribe to get email alerts delivered directly to your inbox
Check Price Action
Follow us on X , Facebook and Telegram
Surf The Daily Hodl Mix
Generated Image: Midjourney
Disclaimer: The content of this article solely reflects the author's opinion and does not represent the platform in any capacity. This article is not intended to serve as a reference for making investment decisions.
You may also like
SOMIUSDT now launched for pre-market futures trading
Fiat 48H Flash Deal: Buy crypto with 0 fees via credit/debit card!
Celebrate the launch of Bitget RWA futures and predict NVIDIA's price to share 1000 USDT!
Bitget to decouple loan interest rates from futures funding rates for select coins in spot margin trading