Bitget App
Trade smarter

Bitcoin is only 200 days away from bull market peak? Historical indicators reveal potential turning points
CryptoChan2024/11/25 04:13
By:CryptoChan
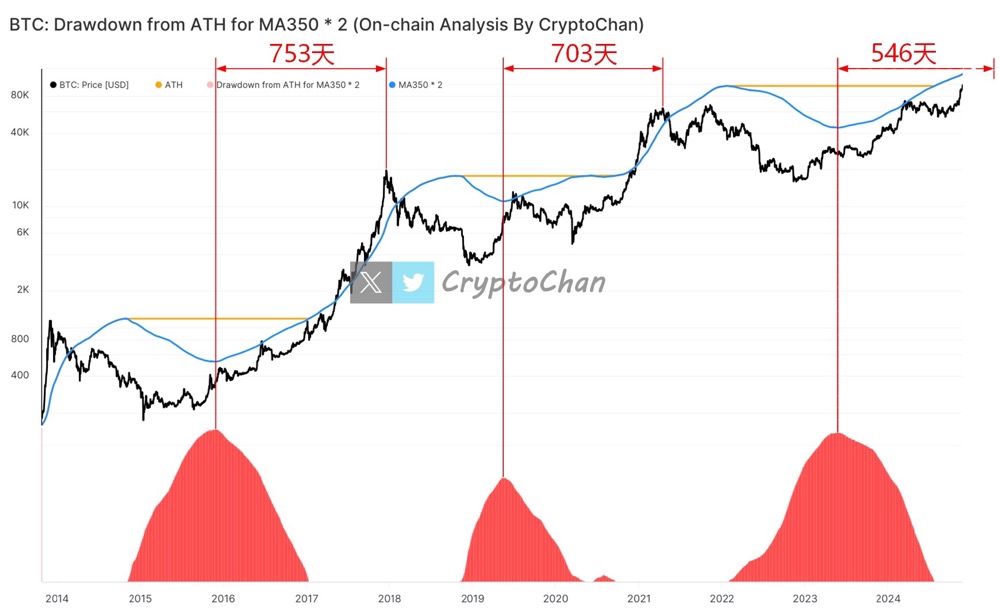
According to CryptoChan's latest on-chain data analysis, the time window for Bitcoin (BTC) to reach the next bull market peak may be gradually becoming clear. From historical data, the interval between the red bar peak and the bull market peak has formed a certain pattern, which provides important reference for the current market.
First, looking back at the red bar peak in 2015, it was 753 days away from the bull market peak of BTC at the end of 2017. Similarly, the red bar peak in 2019 was 703 days away from the bull market peak in the first half of 2021. This relatively fixed time span provides us with a certain basis for predicting future market trends.
The current situation shows that 546 days have passed since the peak of the red bar in 2023. If this historical pattern repeats, we may still be about 200 days away from the potential bull market high.
From the chart, the black curve represents the price trend of BTC, the blue curve represents the 350-day moving average (MA350) of Bitcoin, and the orange curve represents the previous high value of the blue line. The red bar represents the calculation result (orange line - blue line)/orange line, which aims to visually present the difference between the blue and orange lines to reflect the relationship between price and trend.
3
6
Disclaimer: The content of this article solely reflects the author's opinion and does not represent the platform in any capacity. This article is not intended to serve as a reference for making investment decisions.
PoolX: Locked for new tokens.
APR up to 10%. Always on, always get airdrop.
Lock now!
You may also like
Altcoin Season Index at 43 Suggests Bitcoin Season Dominance Amid Market Uncertainty
Coinotag•2025/07/28 03:45

Visualize Value Token Surpasses $10 Million Market Cap on Zora
TokenTopNews•2025/07/28 03:11

Bitcoin Aims for $130K with Key Support Holding
TokenTopNews•2025/07/28 03:11

XRP: Game Over for Bears? Shiba Inu (SHIB) Bounces Back From Grave, Ethereum (ETH) Ready to Explode Past $4,000
CryptoNewsNet•2025/07/28 03:10
Trending news
MoreCrypto prices
MoreBitcoin
BTC
$119,475.34
+0.99%
Ethereum
ETH
$3,930.84
+3.74%
XRP
XRP
$3.3
+2.27%
Tether USDt
USDT
$1
-0.01%
BNB
BNB
$846.92
+6.46%
Solana
SOL
$193.72
+3.04%
USDC
USDC
$0.9999
+0.01%
Dogecoin
DOGE
$0.2472
+2.17%
TRON
TRX
$0.3217
+0.38%
Cardano
ADA
$0.8508
+1.63%
How to sell PI
Bitget lists PI – Buy or sell PI quickly on Bitget!
Trade now
Become a trader now?A welcome pack worth 6200 USDT for new users!
Sign up now