
Solana (SOL) Enters Consolidation Ahead of Possible $200 Comeback

Solana (SOL) shows weak trend strength despite a positive BBTrend. Consolidation near $183 support and $194 resistance signals caution.
Solana (SOL) has been consolidating in recent days, posting a 2.7% decline over the past week. Indicators such as the BBTrend and DMI reflect weak momentum, with the BBTrend slightly positive at 0.14 and the ADX at a low 12, signaling an unclear trend.
SOL’s EMA lines indicate a bearish setup, though the lack of a strong downtrend suggests potential stabilization. Key levels at $183 support and $194 resistance will likely dictate whether SOL continues consolidating or makes a decisive move in the near term.
SOL BBTrend Is Not Strong Yet
Solana BBTrend is currently at 0.14, reflecting a modestly positive outlook as it attempts to reach higher levels. Over the past few days, the BBTrend has been stable, fluctuating between 0 and 1.08, suggesting limited momentum in either direction.
While the indicator’s positive value marks a recovery from its heavily negative levels seen between December 21 and December 26, the lack of significant upward movement implies that SOL is struggling to build the momentum necessary for a stronger rally.
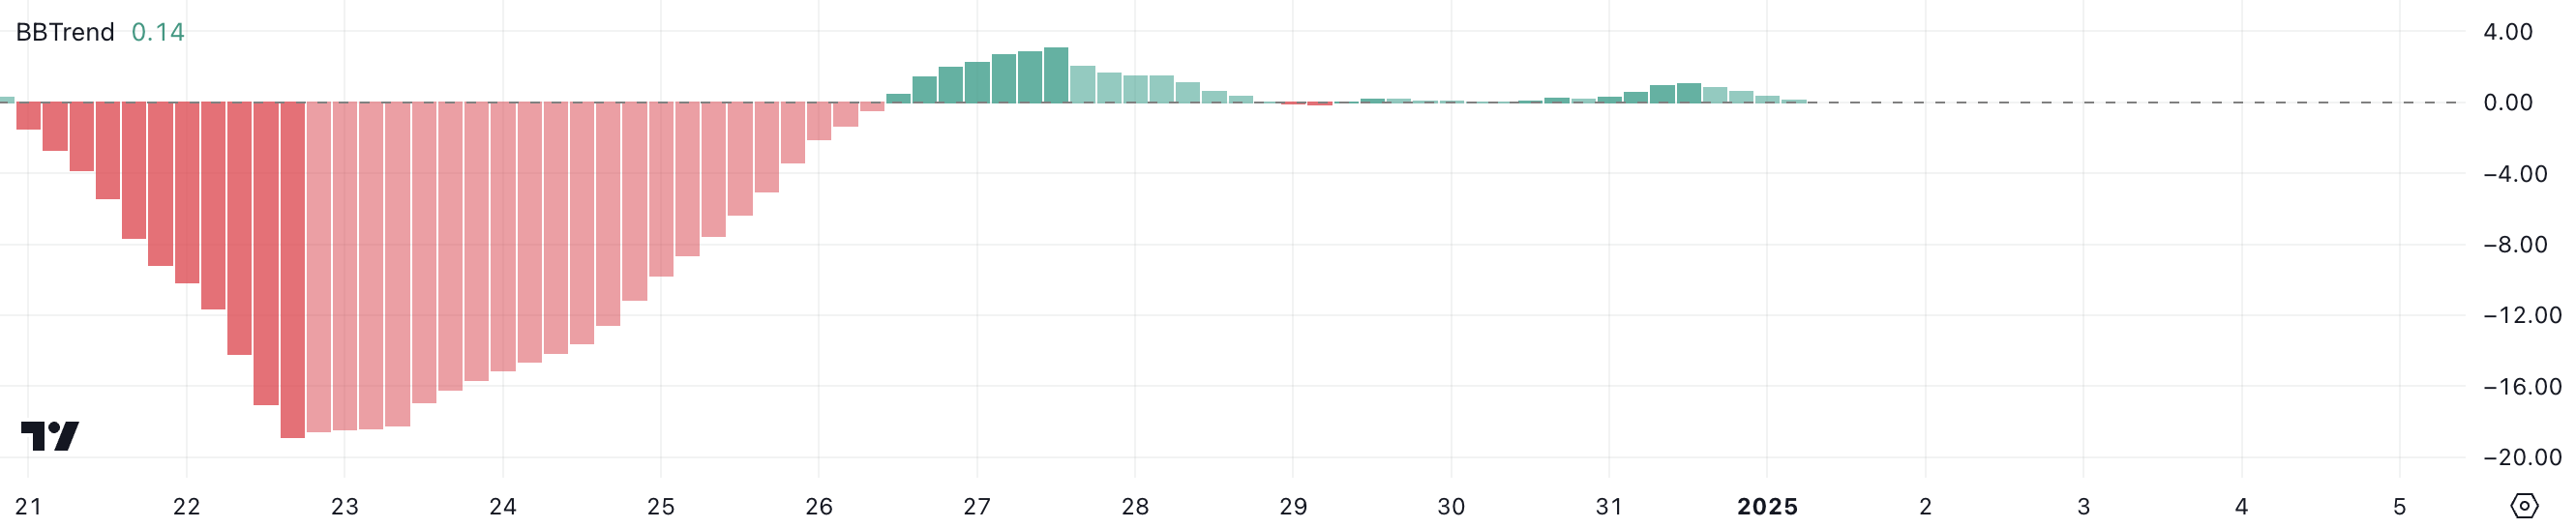 SOL BBTrend. Source:
TradingView
SOL BBTrend. Source:
TradingView
The BBTrend, derived from Bollinger Bands, measures the strength and direction of a trend. Positive values indicate upward momentum, while negative values suggest downward momentum. Although Solana BBTrend is no longer in negative territory, its low positive reading around 0.14 reflects a market environment with subdued strength.
This suggests that while selling pressure has eased, there isn’t enough buying activity to drive a significant breakout, keeping SOL price in a cautious consolidation phase. Further movement in the BBTrend would be necessary to confirm any decisive price action.
Solana Is Stuck in Consolidation
Solana DMI chart shows its ADX currently at 12, remaining below 20 since December 30, indicating weak trend strength. This low ADX reading suggests that the current downtrend lacks significant momentum, reflecting a consolidative market environment.
With both directional indicators (D+ and D-) relatively close, the chart shows a lack of clear dominance, although D- at 18.8 slightly exceeds D+ at 16, maintaining a bearish bias.
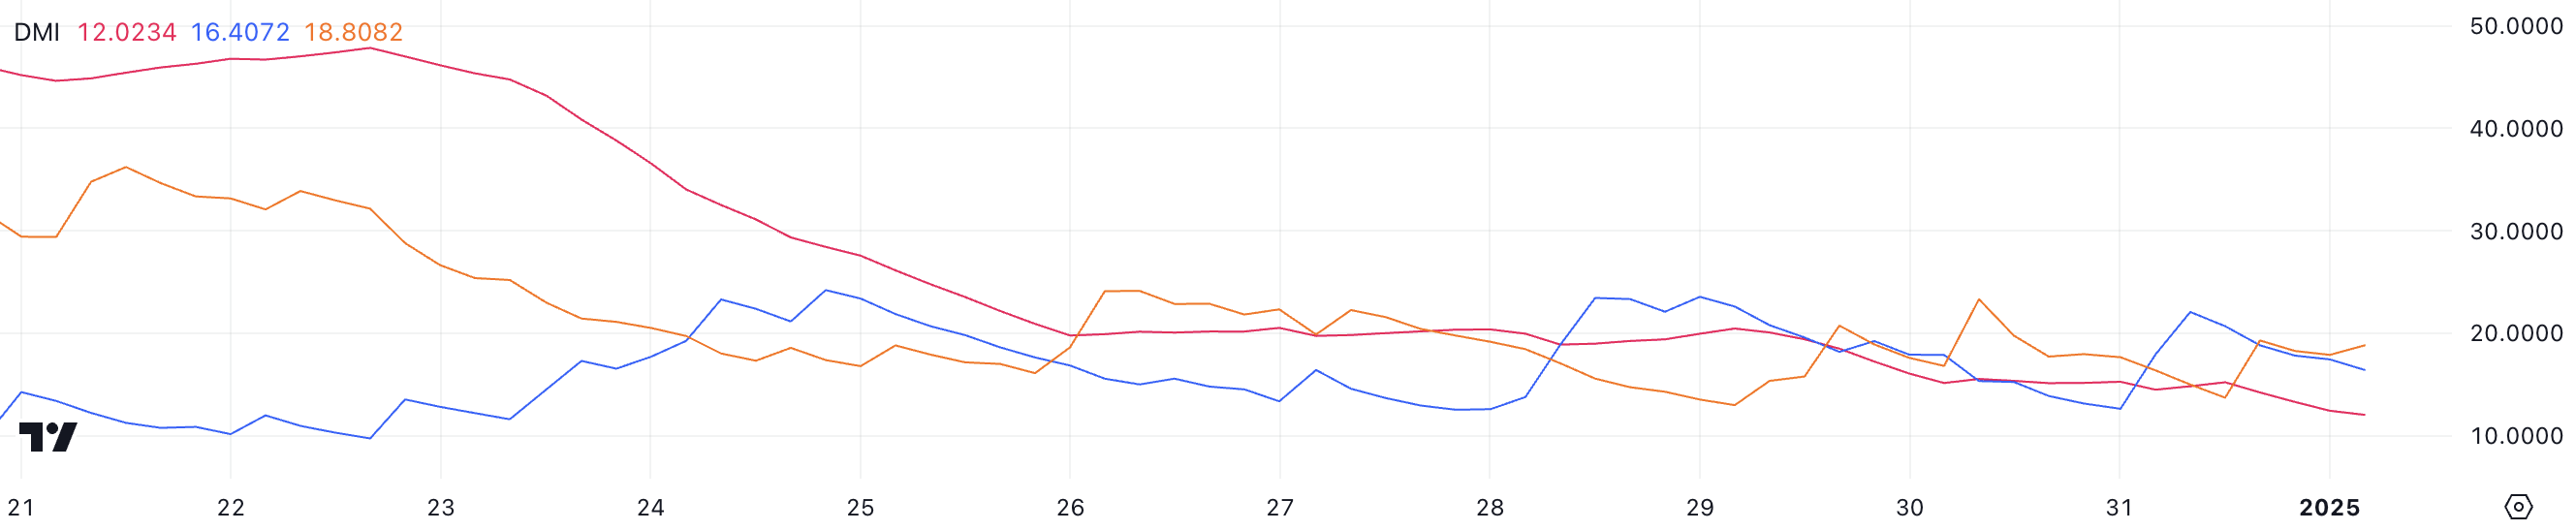 SOL DMI. Source:
TradingView
SOL DMI. Source:
TradingView
The Average Directional Index (ADX) measures trend strength, irrespective of direction, on a scale from 0 to 100. Values above 25 indicate a strong trend, while readings below 20, like SOL current 12, signal a weak or absent trend.
In the short term, this combination of a low ADX and slightly dominant D- suggests that Solana is in a consolidation phase, with the downtrend losing strength but not yet reversed.
SOL Price Prediction: More Side Movements Ahead
The EMA lines for Solana price indicate an overall bearish setup, with long-term lines positioned above short-term ones, reflecting lingering downward momentum. However, as highlighted by the DMI chart and BBTrend, there is currently no strong trend driving SOL price action, which aligns with its consolidative behavior.
If the downtrend strengthens, SOL price could test the support at $183, and a failure to hold this level might push the price further down to $175, signaling increased bearish pressure.
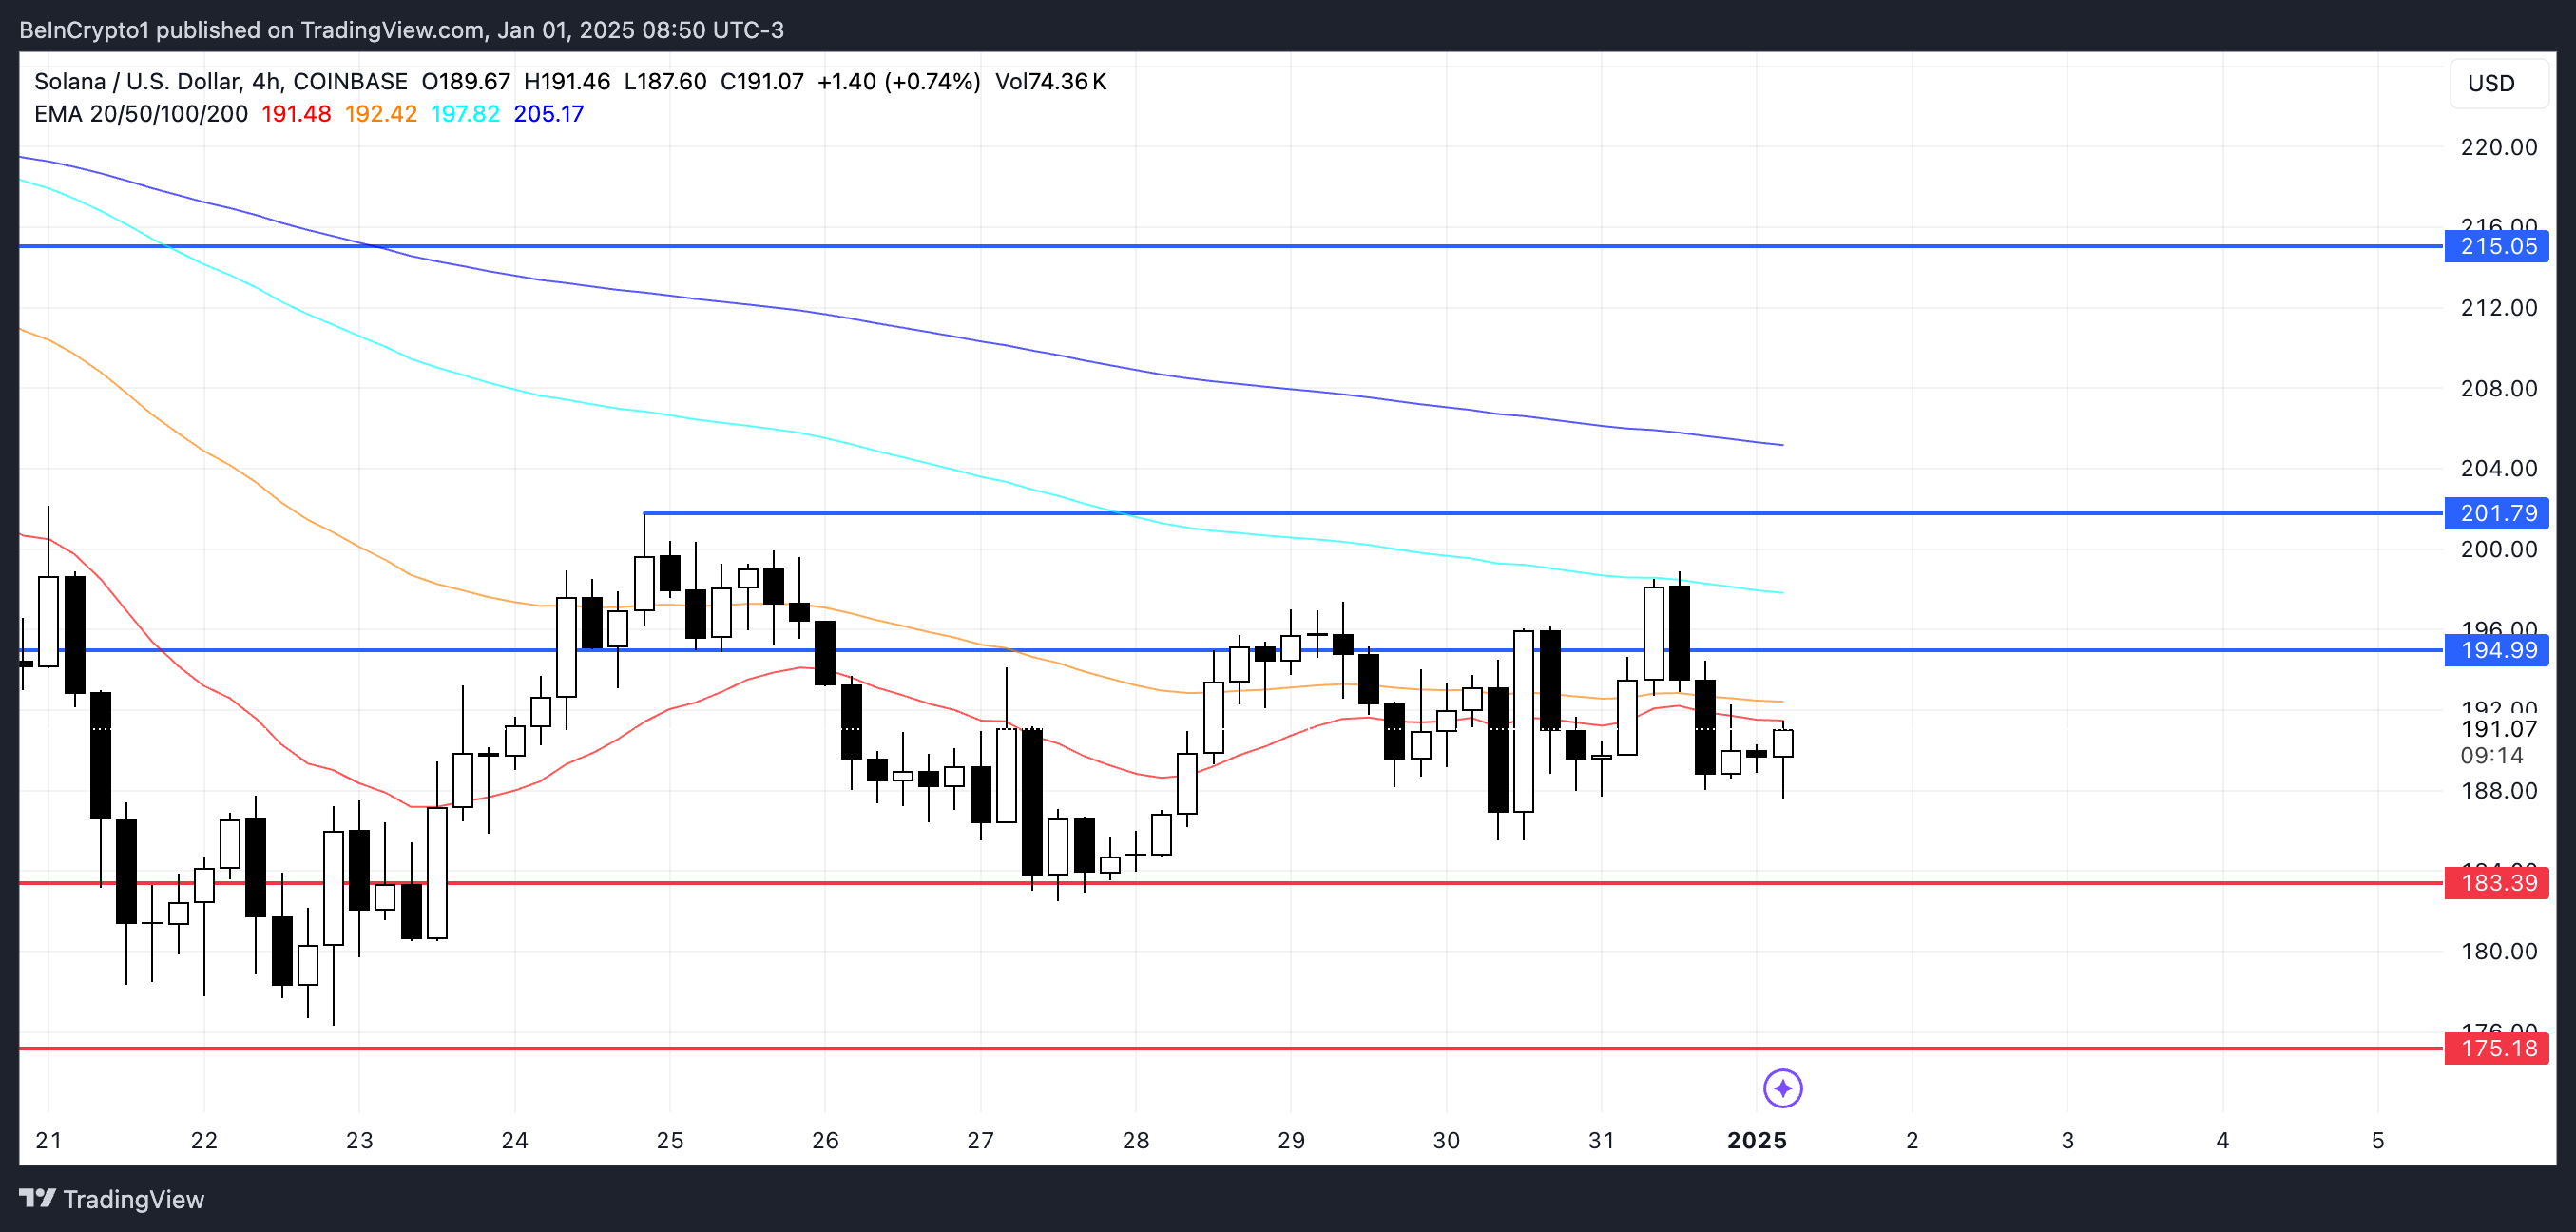 SOL Price Analysis. Source:
TradingView
SOL Price Analysis. Source:
TradingView
Conversely, if SOL price regains its momentum and an uptrend emerges, it could challenge the resistance at $194.
A breakout above this level could lead to a test of the next resistance at $201, with the potential to rise further to $215 if that barrier is also broken.
Disclaimer: The content of this article solely reflects the author's opinion and does not represent the platform in any capacity. This article is not intended to serve as a reference for making investment decisions.
You may also like
ERAUSDT now launched for futures trading and trading bots
PoolX - Unique PUMP Event: Stake SOL for a Chance to Win a 10% Earn APR voucher
ESUSDT now launched for futures trading and trading bots
New spot margin trading pair — CROSS/USDT, TAC/USDT!