Bitcoin USD Eyes $127K: V-Shape Recovery Possible Soon?

Bitcoin USD is showing strong bullish momentum following a V-shaped recovery and a breakout from a falling wedge pattern. With critical resistance levels surpassed, the cryptocurrency is projected to target $108,370.60, $117,908.14, and $127,942.43 in the short-to-mid term.
Recent whale activity, including the withdrawal of 2,173 BTC, further signals reduced selling pressure. It also shows a potential continuation of the rally.
V-Shaped Recovery and Falling Wedge Breakout
The daily chart illustrates a V-shaped recovery, often associated with a strong reversal from bearish conditions. The bulls have driven BTC price back up from a crucial support area at $88,000-$90,000. This is the key to the current upswing.
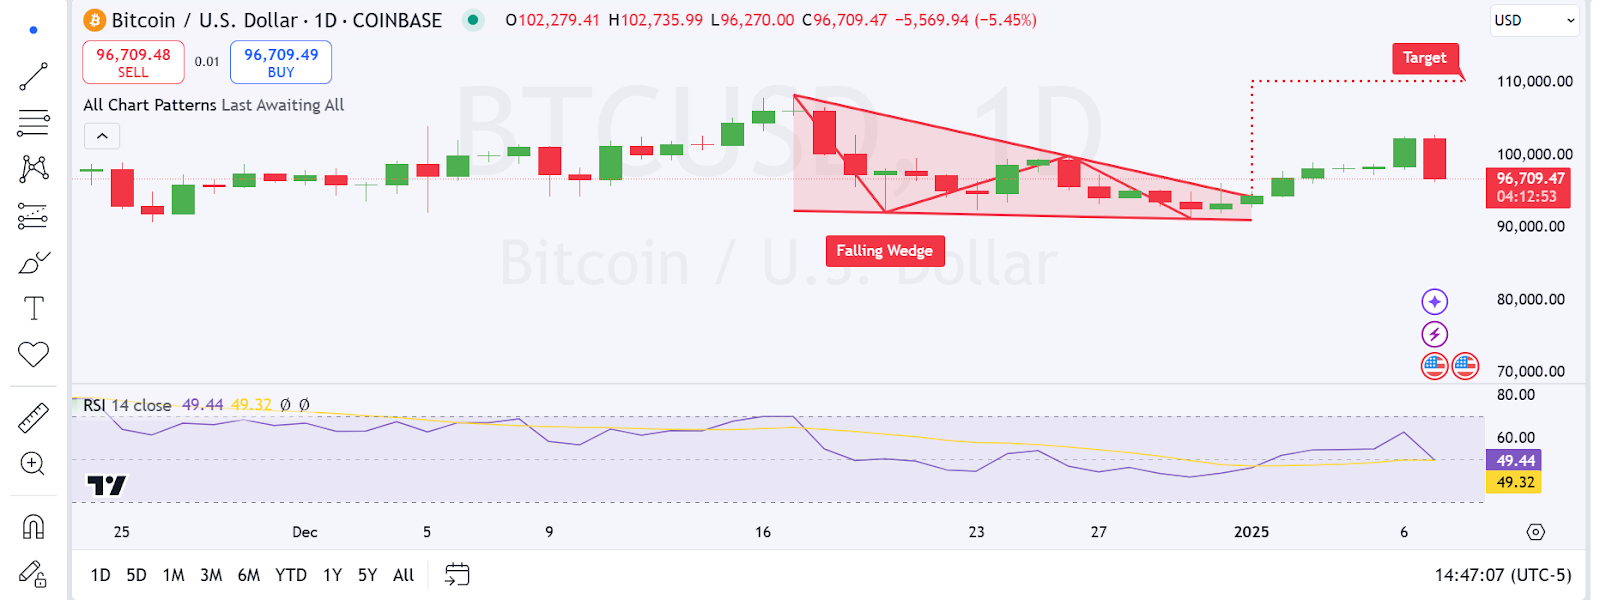
A falling wedge pattern, a bullish formation that consists of two converging lines that slope downwards, is supportive of the upside path. Such a breakout indicates that the consolidation process has been completed and the market continues to develop with an upward trend.
The breakout target of $110,000 can be derived from the height of the wedge line and represents a psychological level.
Bitcoin USD Key Levels of Support and Resistance
The price of bitcoin is at $96,709 after a 5.45% correction. This may have been due to profit-taking or testing of breakout support levels. Key levels have been defined for both support and resistance for the next directional breakout.
The first area of interest is $95,000 which is the breakdown area of the falling wedge and a minor consolidation zone. A stronger support is found at $90,000, that is a round figure and also a prior level of support.
On the opposite, the first level of resistance is observed at $100,000 where there are many sellers. Breaking this resistance could open the path to the first target of $108,370.60 with other target resistance levels at $117,908.14 and $127,942.43.
Momentum Indicators and Whale Activity
As mentioned earlier, momentum indicators afford further appreciation of Bitcoin’s possible path. The Relative Strength Index (RSI) stands at 49.44 while still in the neutral zone, meaning that the market is not overbought or oversold.
A breakthrough 60 on the RSI might suggest that buying pressure has picked up again, whilst a break below 40 could suggest that the buying pressure has started to fade.
Also, whale activity has been a significant driver of Bitcoin’s price surge. The most recent data shows that 2,173 BTC have been pulled out of exchanges, which points to long-term storage by big investors. This diminished selling pressure coupled with rise in buying pressure enhances the possibility of Bitcoin’s path towards its targets.
Bitcoin USD Price Targets and Fibonacci Levels
Bitcoin USD chart forms a rounded bottom pattern that corresponds to the key Fibonacci extension levels, thus supporting the potential bull targets
The first target of $108,370.60 aligns rather well with the 0.618 Fibonacci level. This should make it a strong resistance level.
The second target of $117,908.14 is in line with the 1.0 extension level. The final target of $127,942.43 is in line with the 1.618 level.
Possible Outcomes for Bitcoin Price
Bitcoin USD levels are determined by whether a certain level of support is maintained and whether a resistance level is breached. In a bullish case, BTC holds the $95,000 level and breaks through the $100,000 barrier.
This would likely lead the price to rally towards $108,370.60. There can be further upward momentum pushing the price toward $117,908.14 and $127,942.43.
In a bearish situation, if the price falls below $95,000, it may lead to more selling pressure and push the price down towards $90,000. This could slow down Bitcoin’s journey, but the long-term bulls will not be broken.
Disclaimer: The content of this article solely reflects the author's opinion and does not represent the platform in any capacity. This article is not intended to serve as a reference for making investment decisions.
You may also like
Web3 ai Could Lead 2025’s Best Cryptos With 1,747% ROI, Outshining Toncoin & Chainlink’s Performance
Toncoin (TON) and Chainlink (LINK) show strong market positions, but Web3 ai’s AI-driven platform and sub-$0.001 price point may offer greater potential for exponential growth.Toncoin (TON): Leveraging Telegram’s Ecosystem for GrowthChainlink (LINK): Technical Indicators Point to Potential BreakoutWeb3 ai: Affordable Entry with AI-Driven Security ToolsClosing Thought

Ethereum Set to Soar Past $4,000 Again
Ethereum eyes a comeback above $4,000 with a projected 55% surge amid rising market optimism.What’s Driving the Ethereum Rally?Could Ethereum Break Past Its All-Time High?

Lark Davis: Best Time to Make Money in Crypto
Crypto analyst Lark Davis says this is the best time to make money in crypto. Here’s why you should pay attention now.Why This Window Matters So MuchHow to Lock In for Maximum Gains

Top Rated Cryptos to Buy in 2025: BlockDAG, Tron, Polygon, and Polkadot Line Up Ahead of Q3 Shift
Explore the top rated cryptos to buy in 2025, featuring BlockDAG’s limited-time 'Double Your BDAG' offer, and why Tron, Polygon, and Polkadot are gaining strong attention this year1. BlockDAG (BDAG)2. Tron (TRX)3. Polygon (MATIC)4. Polkadot (DOT)Closing View on Key 2025 Contenders
