
- Ethereum has slipped, trading in the $3.3K zone.
- The market saw $86.39 million worth of Ethereum liquidated.
Bearish momentum dominates the crypto market, pushing the asset’s price on a downward path. Bitcoin (BTC) continues to fall and trade around the $93.3K level, while Ethereum (ETH) is battling to reclaim the $3.5K mark.
ETH has been trading on the downside, recording a 1.73% loss over the last 24 hours. The altcoin’s price failed to break through the $3,354 resistance and extended its losses. ETH must hold its current trading level to avoid further declines.
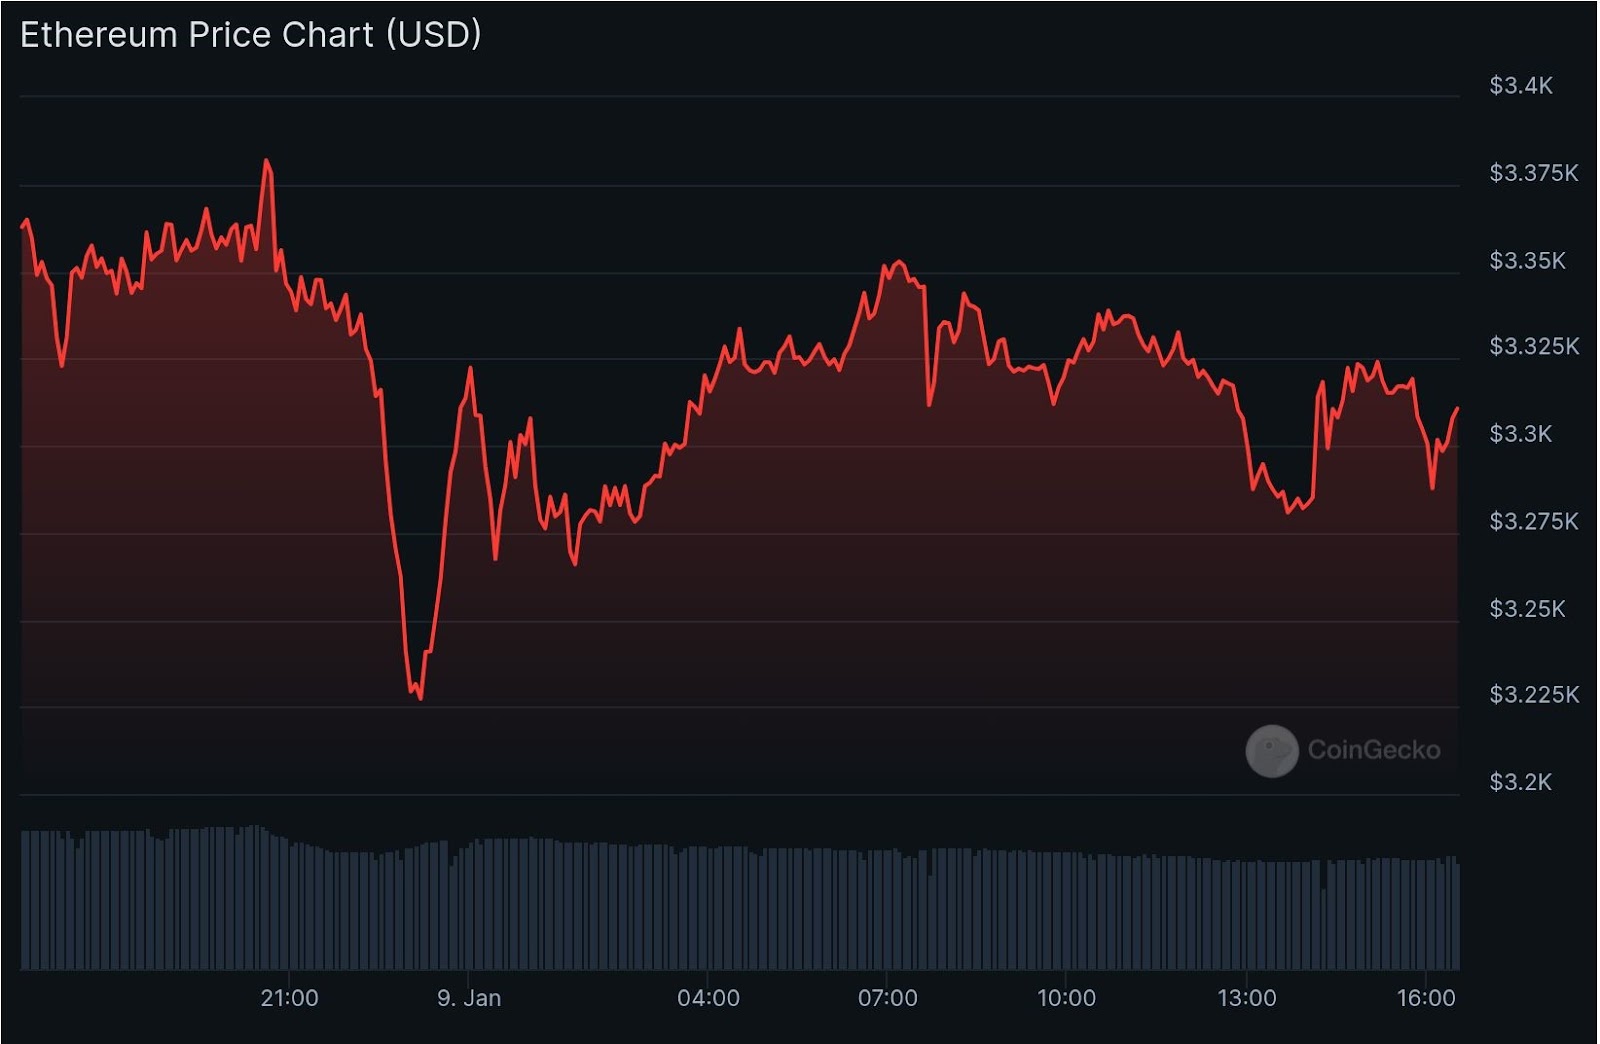
There was a clear downside move at $3,209, and the daily high is marked at $3,384. At press time, ETH traded at $3,307 and the daily trading volume stayed at $31.14 billion. Notably, the market observed a liquidation of $86.39 million worth of Ethereum during this interval.
Is Ethereum Poised for Further Losses?
The ETH/USDT trading pair’s Moving Average Convergence Divergence (MACD) and signal line have crossed below the zero line. This crossover infers strong bearish momentum in the market, and traders often consider avoiding long positions.
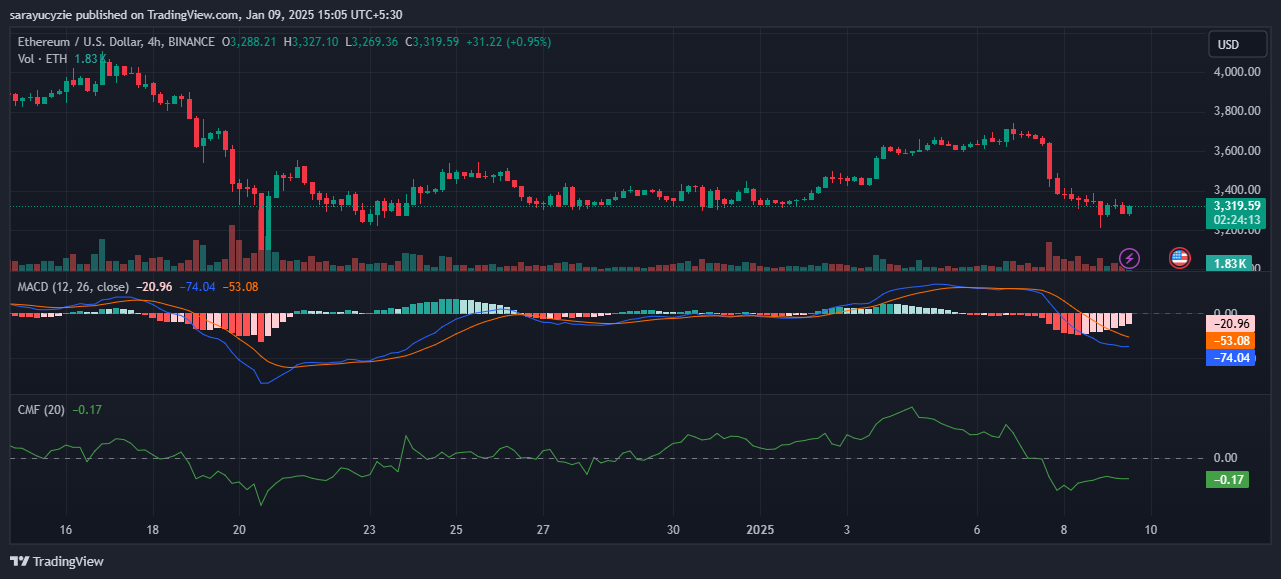
In addition, the Chaikin Money Flow (CMF) indicator, which assesses capital flow, is settled at -0.17. This suggests negative money flow and selling pressure dominating the market. Meanwhile, the daily trading volume of ETH has dropped by over 18.52%.
The four-hour trading pattern of ETH reports continuous resilience to break the $3.5K mark. If ETH continues to underperform, the altcoin price could visit its former low of $3.2K. In a highly bearish scenario, this could potentially send the price down to the $3K range.
On the upside, if the buyers are in control, the ETH price might aim for the nearby resistance at $3,463. Holding above the $3.6K level triggers an upside correction, and Ethereum targets a highly bullish $4K mark.
The altcoin’s daily frame has displayed the short-term 50-day moving average below the long-term 200-day moving average. Moreover, the daily relative strength index (RSI) resting at 32.55 is approaching the oversold zone. It further reflects weakening buying pressure and a growing downtrend.