ETH Price Prediction: What's Next?

Ethereum (ETH) , the second-largest cryptocurrency by market capitalization, continues to play a vital role in the blockchain ecosystem, serving as the foundation for decentralized finance (DeFi), non-fungible tokens (NFTs), and countless dApps. With its price recently encountering key resistance and support levels, traders and investors are closely monitoring ETH's trajectory. In this analysis, we will examine Ethereum’s price chart, focusing on technical indicators and key market patterns, to determine what could be next for ETH in the short to medium term.
How has the Ethereum Price Moved recently?
Ethereum is currently trading at $3,217 , with a 24-hour trading volume of $23.06 billion. The cryptocurrency has a market capitalization of $386.66 billion, commanding a market dominance of 11.38%. Over the past 24 hours, the price of ETH has dropped by 1.16%.
Ethereum achieved its all-time high price of $4,867.17 on November 10, 2021, while its all-time low of $0.420897 was recorded on October 21, 2015. Since reaching its peak, ETH's lowest price has been $897.01 (cycle low), and its highest price since that cycle low was $4,094.18 (cycle high). The current market sentiment for Ethereum remains bearish, with the Fear & Greed Index indicating a value of 70 (Greed).
The circulating supply of Ethereum stands at 120.49 million ETH, with a yearly inflation rate of 0.26%, equating to an additional 309,826 ETH created over the past year.
ETH Price Prediction: Chart Analysis
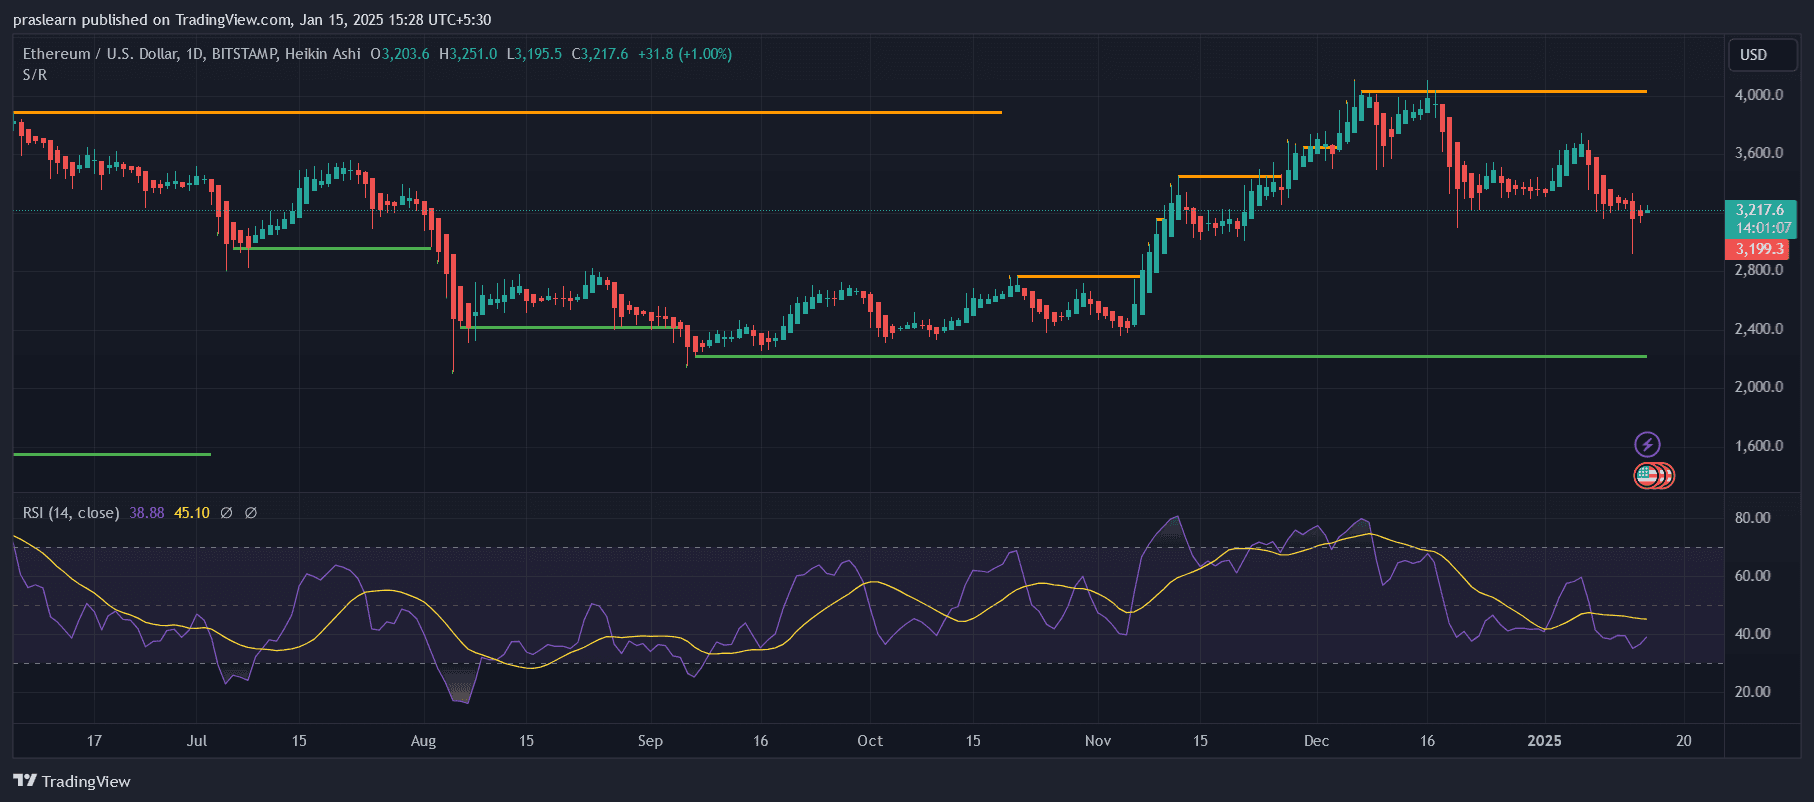 ETH/USD Daily Chart- TradingView
The daily chart reveals Ethereum trading around $3,217, recovering marginally from its recent low of $3,199. ETH Price action has exhibited a clear rejection near the $4,000 resistance zone, marked by a horizontal orange line. Conversely, support at the $2,800 level (horizontal green line) has remained robust, forming a crucial floor for buyers.
Key Observations
Support and Resistance Levels
- Resistance Zones: The price failed to break above $4,000, reflecting strong seller interest at this level. This zone has acted as a critical ceiling in the last few months.
- Support Zones: The $2,800 mark has proven to be a reliable support level, providing a solid base for price recovery in earlier downtrends.
RSI Insights
- The Relative Strength Index (RSI) on the 14-day period hovers at 38.88, indicating oversold conditions. This suggests that the recent sell-off may be nearing exhaustion, potentially paving the way for a rebound.
- However, RSI's failure to cross above the midline (50) in the past reflects weak bullish momentum, which could delay a strong recovery.
Trend Momentum
- The price is currently below key moving averages, signaling a bearish bias in the short term. This aligns with the inability to sustain gains above the $3,600-$3,800 range.
- The Heikin Ashi candles show a lack of strong bullish momentum, with recent candles reflecting hesitation and bearish continuation.
What's Next for ETH?
- Bullish Scenario If ETH sustains above the $3,200 level and RSI begins to rise above 45, a potential breakout above $3,600 could occur. This move would likely target the $4,000 resistance level once again. A decisive breakout above $4,000 could signal renewed bullish strength, opening the path to $4,200 and beyond.
- Bearish Scenario Failure to maintain the $3,200 support could push ETH back toward the $2,800 zone. If this support is breached, further downside is possible, with $2,400 being the next critical level of interest.
- Neutral Scenario ETH could consolidate between $3,200 and $3,600 as the market digests recent price action. This range-bound activity may continue until a strong fundamental or technical catalyst emerges.
Conclusion
Ethereum's price currently sits at a pivotal juncture, with the market facing key support at $3,200 and resistance at $4,000. While the RSI indicates potential oversold conditions, signaling a chance for recovery, overall market momentum appears to lean bearish. Traders should closely monitor ETH’s interaction with the $3,200 and $2,800 levels in the coming days, as well as broader market trends, including Bitcoin’s movement.
ETH’s medium-term outlook hinges on breaking key resistance levels to rekindle bullish sentiment or maintaining critical supports to avoid a deeper correction. Stay alert to updates in the macroeconomic environment and Ethereum’s ecosystem developments, as these will influence the price trajectory significantly.
Disclaimer: The content of this article solely reflects the author's opinion and does not represent the platform in any capacity. This article is not intended to serve as a reference for making investment decisions.
You may also like
Ethereum Network Gas Limit Increased as Major Upgrades Are Prepared

Ethereum Inflows Reach Record $2.12 Billion in One Week
Over $3.43 Billion in Ethereum Lost
Strategy Aims for 900,000 BTC Holding by 2027