

-
Solana (SOL) is currently forming a broadening wedge pattern on its price charts, signaling a potential increase in volatility in the near term.
-
The price action shows that SOL has been consolidating, with significant resistance levels identified, suggesting traders should remain vigilant for breakout opportunities.
-
“If Solana breaks out of this structure, it could lead to substantial price gains,” an analyst noted, indicating the importance of the $150-$160 resistance zone.
This article explores Solana’s current market position, analyzing patterns and resistance levels that could impact future price movements.
Solana’s broadening wedge and potential breakout
The formation of a broadening wedge indicates a period of consolidation characterized by expanding price swings. Analysts view these patterns as precursors to increased volatility, often leading to decisive breakouts. Key resistance levels to watch include $177, $203, $224, $245, and $270, all of which correspond to important Fibonacci extension levels.
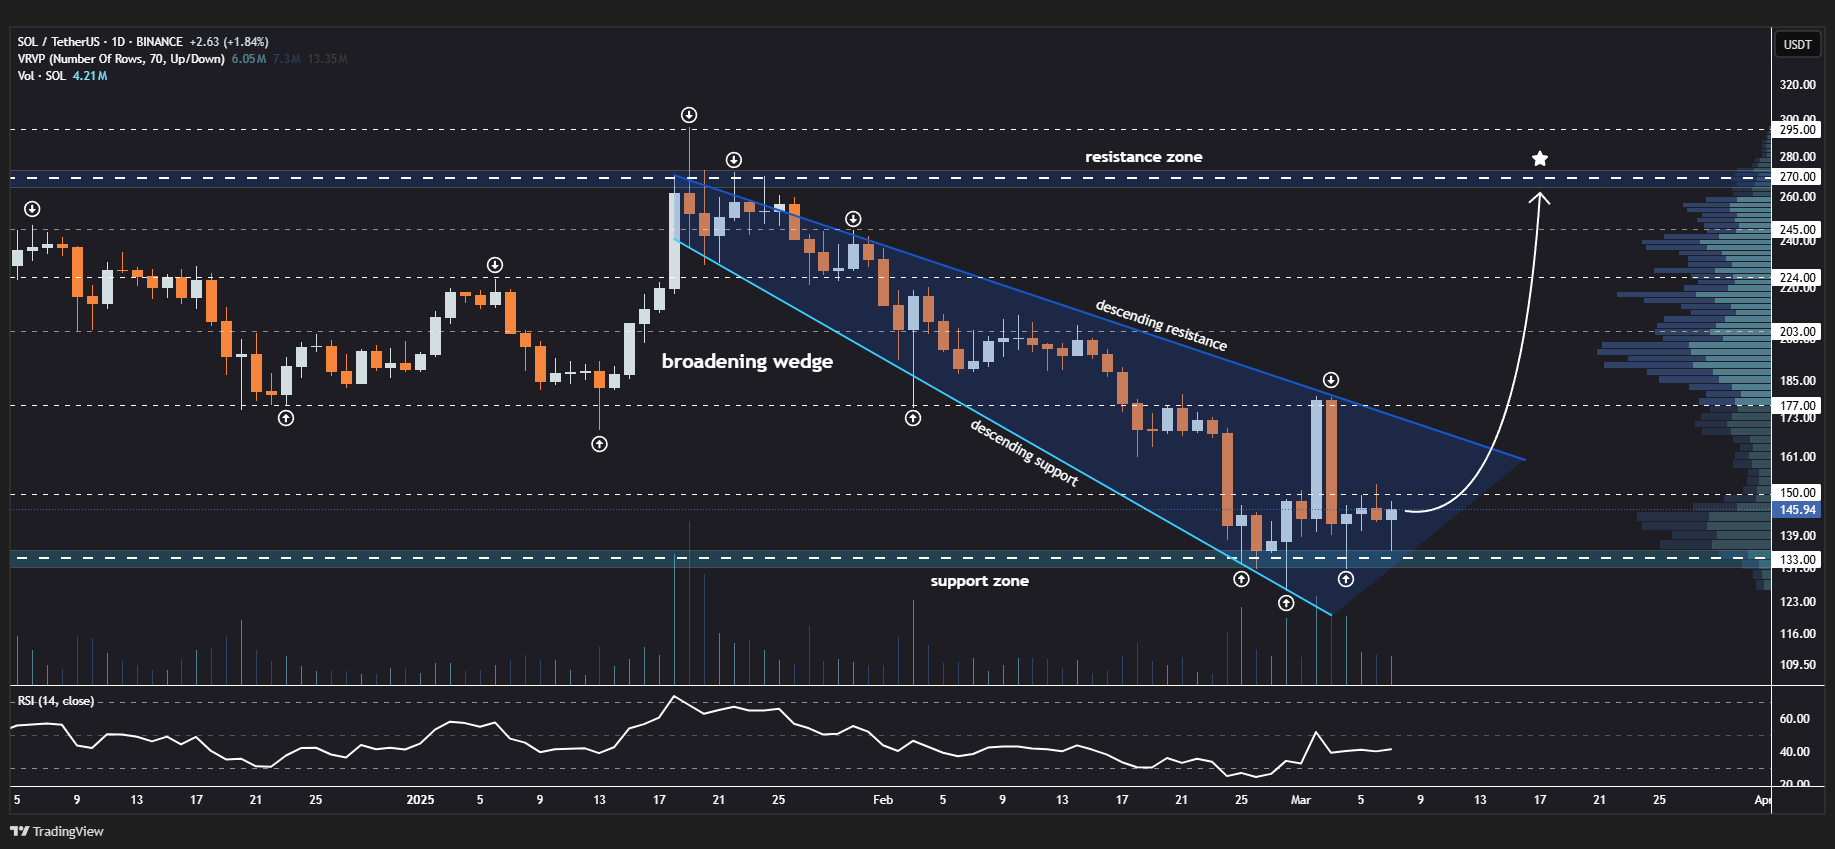
According to technical analysis, a breakout above the descending resistance line of the wedge could signal a continuation of the bullish trend, potentially pushing SOL towards the upper resistance zones. Conversely, a failure to break this resistance may lead to prolonged consolidation within the wedge’s confines.
SOL’s right-angled ascending broadening pattern
A right-angled ascending broadening pattern is also notable on Solana’s chart, which further supports the expectations of increased volatility. These patterns are typically indicative of strong price action, often culminating in notable moves as market sentiment shifts and trading volume increases.
Should Solana manage to break free from this pattern, traders should focus on immediate resistance at $177 and $200, with psychological barriers surfacing around $245 and $270. On the flip side, immediate support is at $133, a historically significant demand zone.
Where is SOL heading?
As of now, Solana’s price reflects a trading value of $138.97, facing resistance near the 50-day moving average at $163.81. The Relative Strength Index (RSI) currently sits at 42.71, implying that there remains potential for upward movement before reaching overbought territory.
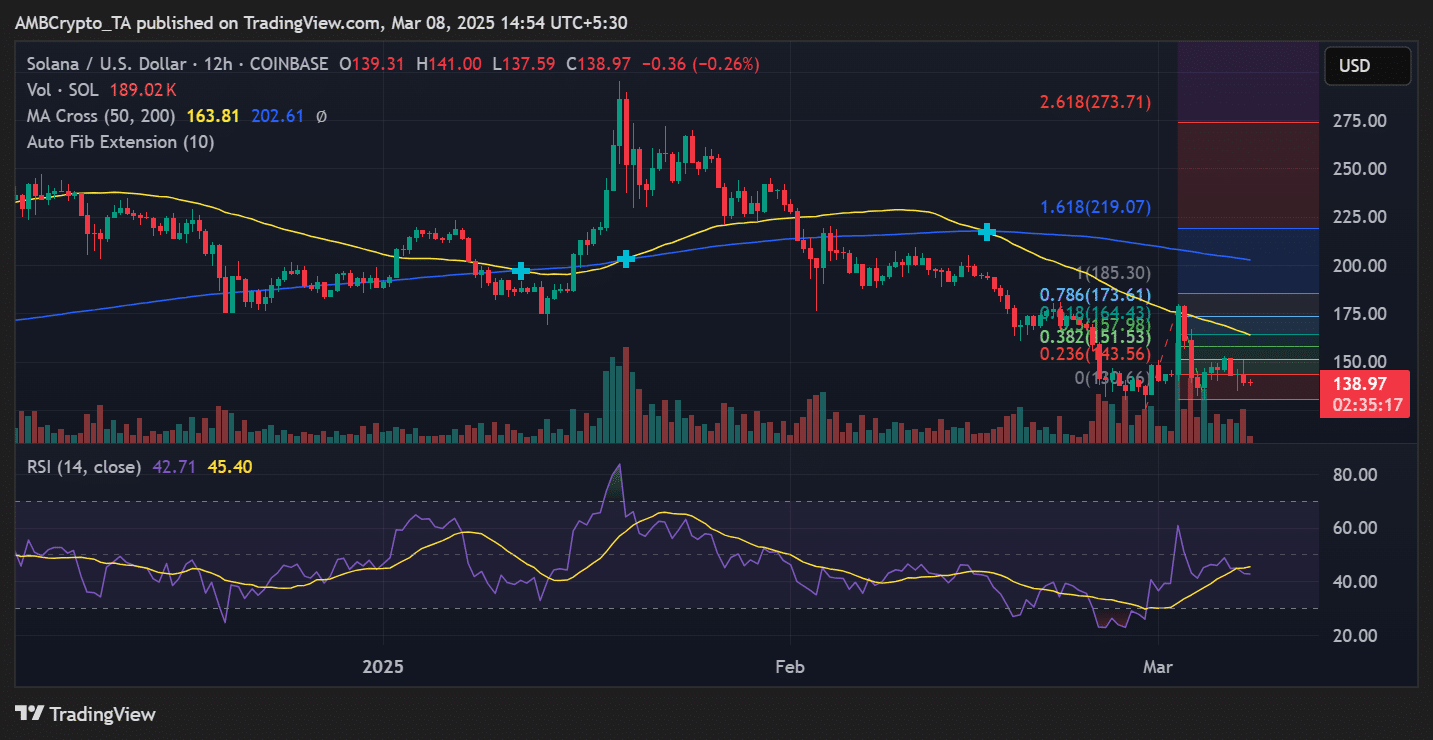
Market volume is moderate, indicating a cautious approach among traders, many of whom await confirmation of breakout signals before entering larger positions. A movement above $145 could mark a bullish reversal, accelerating SOL’s pricing trajectory toward higher resistance levels.
Will Solana break out?
The technical indicators currently suggest that a breakout could be on the horizon, with Solana consolidating within two significant patterns: the broadening wedge and the right-angled ascending broadening pattern. If buyers succeed in pushing SOL through the critical resistance levels of $150-$160, the cryptocurrency could potentially surge toward $200 and beyond.
However, if the asset fails to gather momentum, it may remain in a consolidation phase within the $130-$145 range. Traders are advised to monitor volume fluctuations, RSI movements, and any pertinent breakout confirmations before committing to substantial trades, as the coming days will be crucial in determining Solana’s trajectory.
Conclusion
In summary, Solana’s current patterns and price levels indicate a pivotal moment that could lead to a notable price breakout or a continuation of consolidation. Understanding the dynamics of these technical formations and keeping an eye on volume activity will be essential for traders looking to capitalize on potential movements in the Solana market.