
Bitcoin Meanders Sideways And Stays Above $80,000

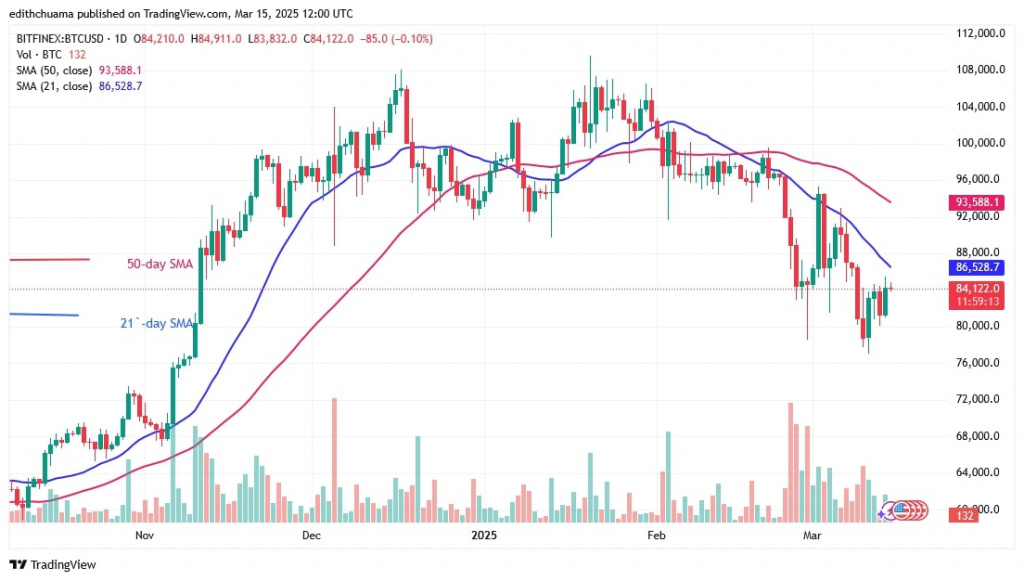
The price of Bitcoin (BTC) has remained above the $80,000 support but below the lines of the moving averages. Price analysis by Coinidol.com.
BTC price long-term prediction: bearish
The bulls bought the dip, although the bears repeatedly broke below the $80,000 support. For example, the downtrend fell below $80,000 on March 11 and reached a low of $77,041. At the time of writing, Bitcoin has reached a high of $83,301.
Bitcoin will rise to the 50-day SMA if it breaks above the 21-day SMA. If Bitcoin breaks the 50-day SMA barrier, it will reach the psychological price threshold of $100,000. Bitcoin will continue its rise above the $80,000 support but below the moving average lines if it turns down from the 21-day SMA barrier.
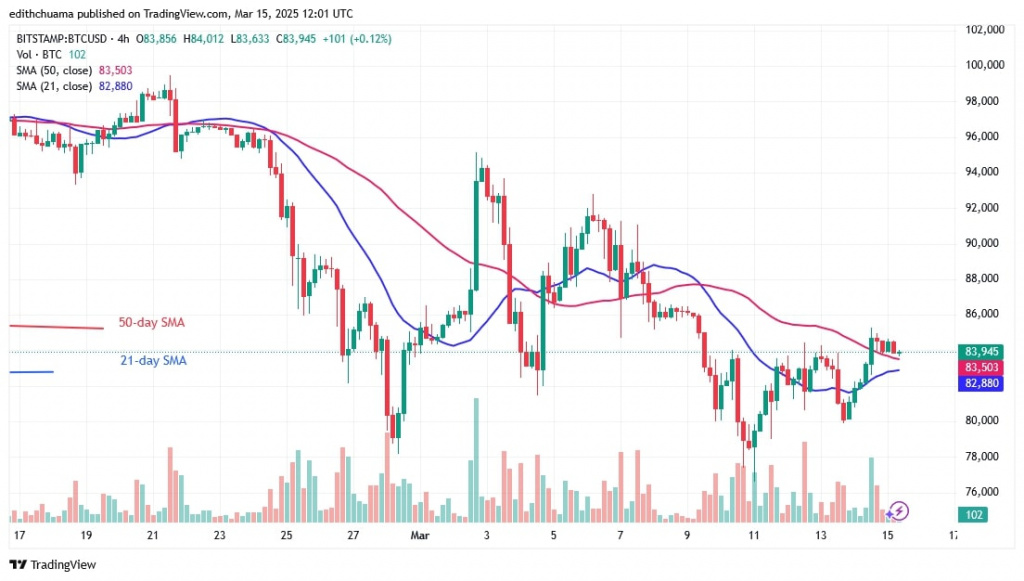
Analysis of BTC price indicators
The price bars are settling below the moving average lines. The price bars on the 4-hour chart are above the moving average lines, but since doji candlesticks are present, the price movement has remained stationary.
On the 4-hour chart, the sideways movement is indicated by the horizontal moving average lines.
Technical indicators
Key supply zones: $108,000, $109,000, $110,000
Key demand zones: $90,000, $80,000, $70,000
What is the next move for Bitcoin?
After the price drop on February 28, Bitcoin has started to meander sideways. The price has pulled back to $80,000 today, although it is still below the 21-day SMA barrier or resistance at $86,000.
The 21-day SMA barrier has hindered the rising prices on the daily chart. As long as buyers keep the price above the moving average lines, Bitcoin will continue its uptrend.
Disclaimer. This analysis and forecast are the personal opinions of the author. They are not a recommendation to buy or sell cryptocurrency and should not be viewed as an endorsement by CoinIdol.com. Readers should do their research before investing in funds.
Disclaimer: The content of this article solely reflects the author's opinion and does not represent the platform in any capacity. This article is not intended to serve as a reference for making investment decisions.
You may also like
Notice: Maintenance for VND deposit service
TAUSDT now launched for futures trading and trading bots
Bitget to decouple loan interest rates from futures funding rates for select coins in spot margin trading
Bitget Launches HYPE On-chain Earn With 2.1~4.5% APR