
Onyxcoin (XCN) Slides 40% in March as Bearish Momentum Continues

Onyxcoin (XCN) stays under selling pressure, with weak technicals pointing to deeper downside risks. Traders watch $0.010 support closely.
Onyxcoin (XCN) has been under significant selling pressure, correcting by 9.4% over the last seven days and plunging by 43% in the past 30 days.
The downtrend has left XCN struggling to regain its footing as technical indicators continue to point toward a bearish market structure. Despite short-lived attempts at recovery, the asset has remained weighed down by persistent bearish momentum.
Onyxcoin RSI Has Been Below 50 For Almost 5 Days
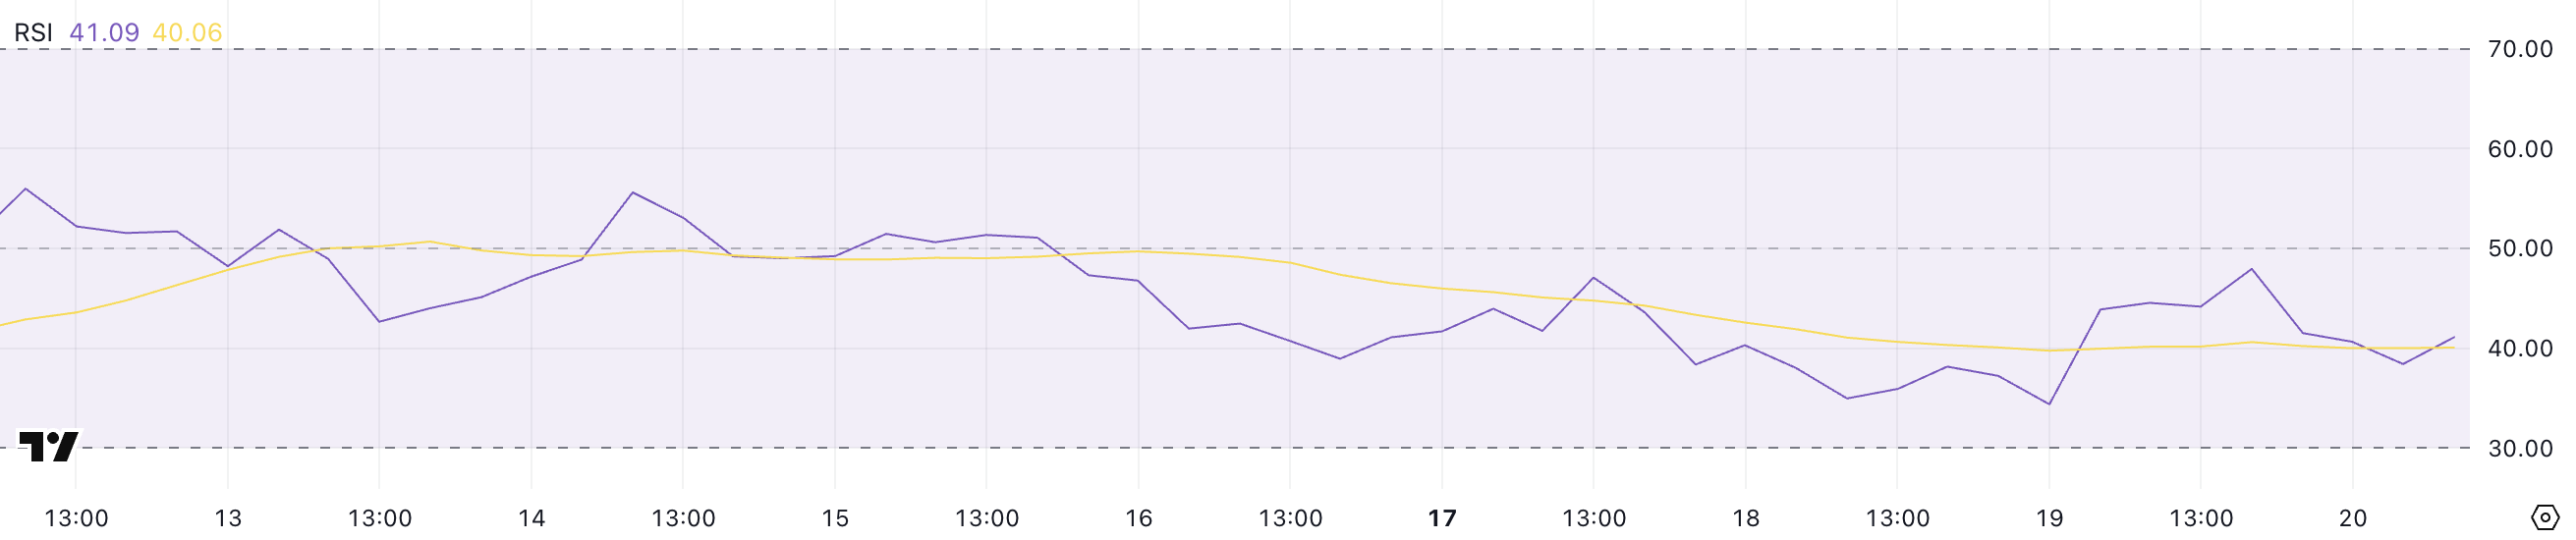
Onyxcoin RSI is currently sitting at 41.09, marking a decline from yesterday’s level of 47.95. This drop indicates that bearish momentum has been gaining ground over the past 24 hours, pushing the RSI further away from the neutral 50 mark.
Since March 15, XCN’s RSI has remained consistently below 50, signaling that the asset has been under persistent selling pressure.
The continued weakness reflected in the RSI suggests that bulls are struggling to regain control, keeping the price in a bearish or consolidative phase.
 XCN RSI. Source:
TradingView.
XCN RSI. Source:
TradingView.
The RSI (Relative Strength Index) is a momentum oscillator that measures the speed and magnitude of recent price changes to evaluate overbought or oversold conditions.
Typically, an RSI above 70 signals that an asset might be overbought and due for a pullback, while an RSI below 30 indicates that the asset could be oversold and might see a bounce. With XCN’s RSI at 41.09 and stuck below 50 for several days, it suggests the market remains tilted toward bearish sentiment.
While it’s not yet in oversold territory, the ongoing sub-50 readings highlight the lack of bullish momentum and could imply continued sideways or downward movement unless buyers step in to reverse the trend.
XCN BBTrend Shows Selling Pressure Is Still Here
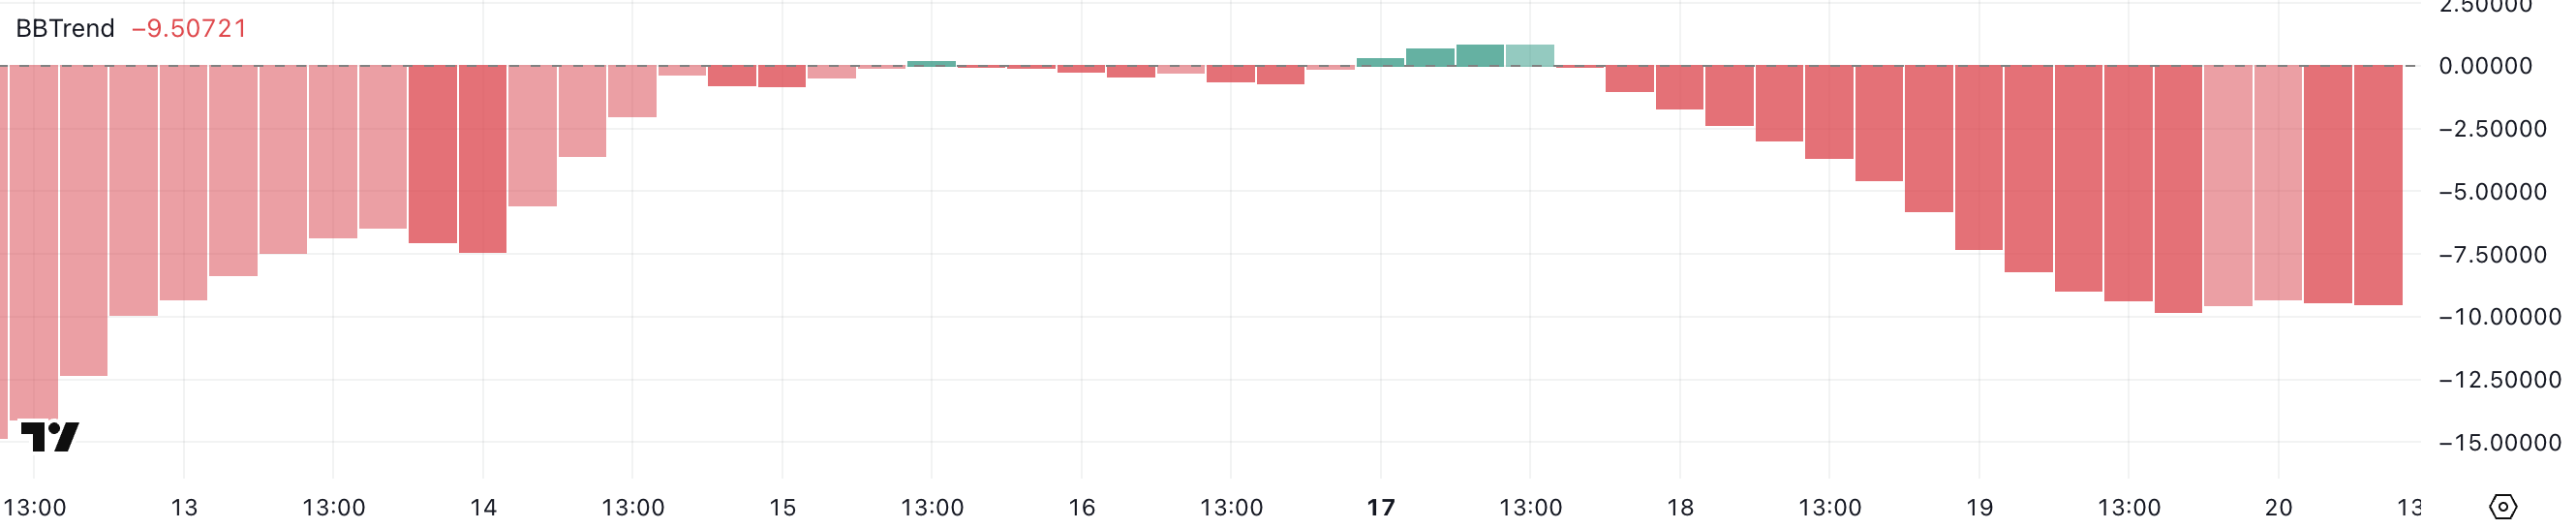
Onyxcoin BBTrend is currently at -9.5 and has remained in negative territory for the past two days, signaling a bearish environment.
Earlier, on March 17, BBTrend briefly turned positive at 0.83 but failed to sustain upward momentum, quickly reverting back below zero. This inability to maintain positive readings suggests that bullish attempts have been weak and short-lived, reinforcing the notion that sellers continue to dominate the market.
The deepening negative value of the BBTrend reflects ongoing pressure on XCN’s price, keeping it under strain.
 XCN BBTrend. Source:
TradingView.
XCN BBTrend. Source:
TradingView.
The BBTrend, or Bollinger Band Trend indicator, measures price trends based on the positioning of price action relative to the Bollinger Bands.
When BBTrend values are above zero, it indicates that the price is trading above the midline (typically the 20-period moving average), suggesting bullish momentum. Conversely, negative values point to prices trending below the midline, indicating bearish momentum.
With XCN’s BBTrend at -9.5 and struggling to establish positive values, it signals that the asset continues to lack strong bullish pressure, leaving the price vulnerable to further downside or prolonged consolidation.
Will Onyxcoin Fall Below $0.010 In March?
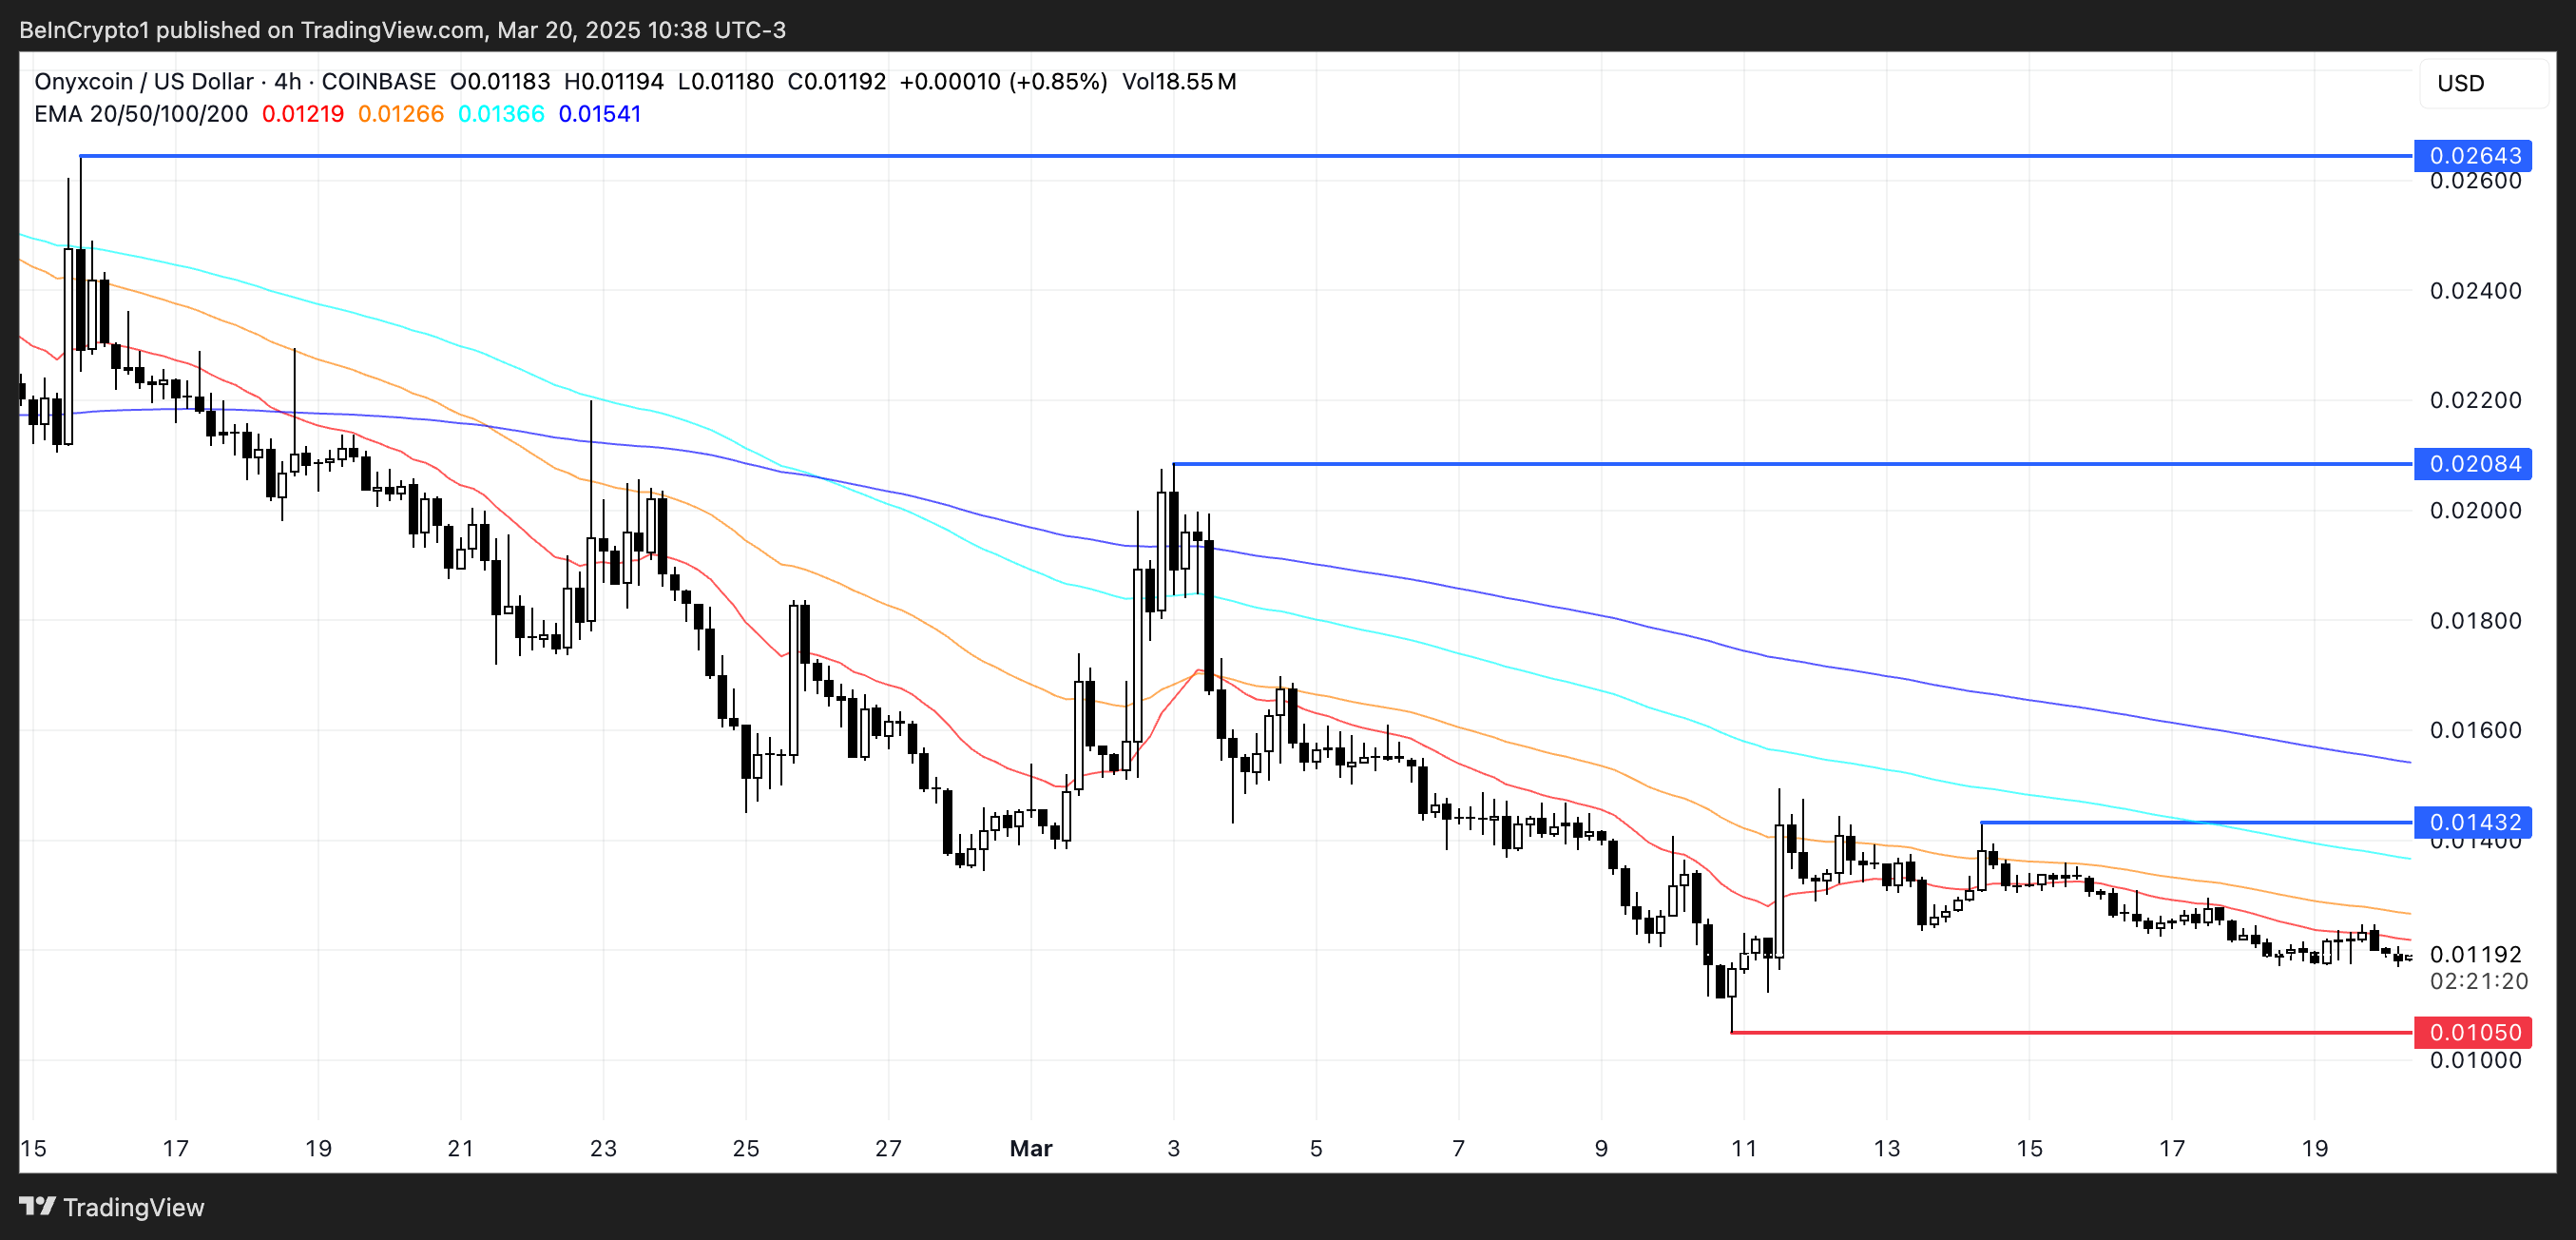
Onyxcoin EMA lines are showing a bearish configuration, with short-term moving averages positioned below the long-term ones.
This alignment suggests that downward momentum is prevailing, increasing the likelihood of further price declines. If XCN continues to trend lower, it could fall below the key support at $0.010, a level not seen since January 17.
 XCN Price Analysis. Source:
TradingView.
XCN Price Analysis. Source:
TradingView.
However, if Onyxcoin manages to regain the strong bullish momentum it demonstrated at the end of January – when it became one of the best-performing altcoins in the market – it could reverse this setup.
In that case, XCN might challenge resistance levels at $0.014 and $0.020, with the potential to climb as high as $0.026 if buyers step in aggressively.
Disclaimer: The content of this article solely reflects the author's opinion and does not represent the platform in any capacity. This article is not intended to serve as a reference for making investment decisions.
You may also like
Subscribe to TANSSI Savings and enjoy up to 15% APR
TACUSDT now launched for futures trading and trading bots
VELVETUSDT now launched for futures trading and trading bots
Bitget Spot Bot adds PUMP/USDT