
Ethereum Continues Its Sideways Movement

The price of Ethereum has been bouncing back and forth between the $1,750 support and the $2,100 resistance as shown by the moving average lines.
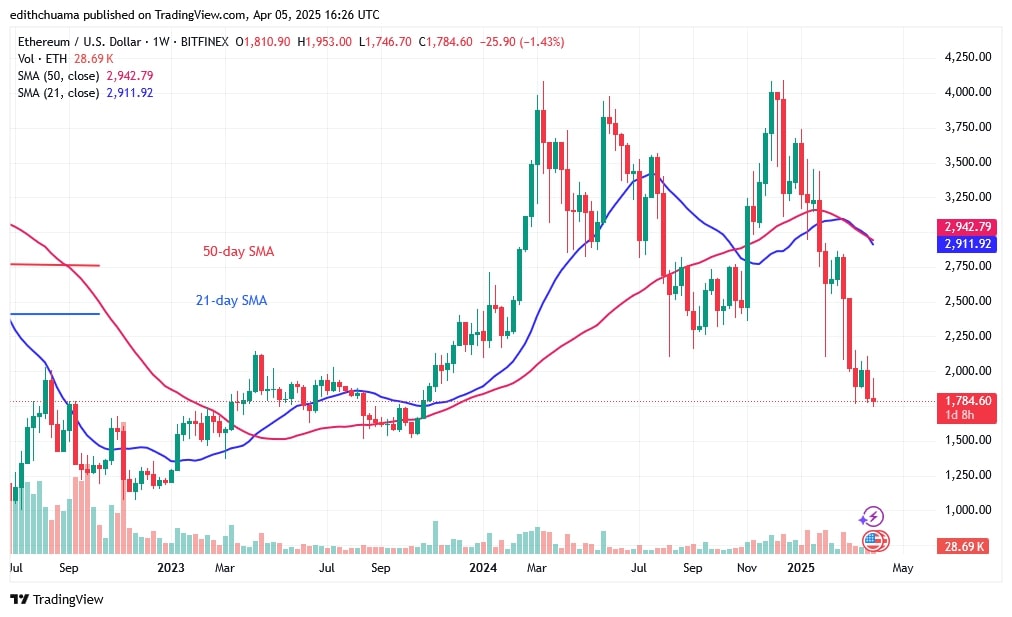
Ethereum price long-term analysis: bearish
Buyers have protected support at $1,750 since March 10, as reported by Coinidol.com. Nevertheless, resistance at $2,100 has hindered upward movement. Ether has been bearish since the 21-day SMA barrier was rejected on April 2.
Now the negative trend has broken through support at $1,800. The largest altcoin is felling, and may fall to the low of $1,550 if the current support is broken. However, if buyers push the price above the moving average lines, Ether will rise to a high of $2,400.
Analysis of the Ethereum indicators
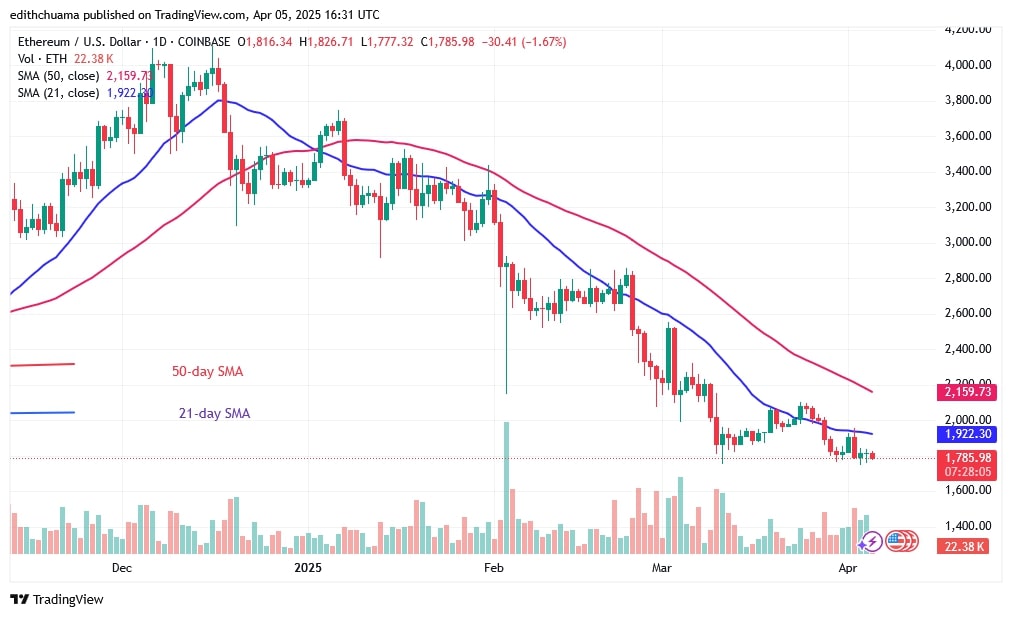
The price bars on the weekly chart are below the moving average lines, which run horizontally downwards. The price bars on the daily chart are below the moving average lines, which are sloping southwards. The moving average lines indicate a downward trend in prices. As Ether pauses above the current support, the downtrend has reached bearish fatigue.
Technical Indicators:
Key Resistance Levels – $4,000 and $4,500
Key Support Levels – $2.000 and $1,500
What is the next direction for Ethereum?
Ethereum has completed its slide since March 10 above support at $1,750. The largest altcoin is now in a sideways movement. The downtrend continues as the cryptocurrency retests the $1,750 support.
However, the use of doji candlesticks has limited the price movement.
Disclaimer. This analysis and forecast are the personal opinions of the author. They are not a recommendation to buy or sell cryptocurrency and should not be viewed as an endorsement by CoinIdol.com. Readers should do their research before investing in funds.
Disclaimer: The content of this article solely reflects the author's opinion and does not represent the platform in any capacity. This article is not intended to serve as a reference for making investment decisions.
You may also like
Bitget to decouple loan interest rates from futures funding rates for select coins in spot margin trading
Bitget to decouple loan interest rates from futures funding rates for select coins in spot margin trading
Bitget Launches PLUME On-chain Earn With 4.5% APR
Bitget Trading Club Championship (Phase 2) – Grab a share of 50,000 BGB, up to 500 BGB per user!