Date: Sun, April 20, 2025 | 11:10 AM GMT
The cryptocurrency market has been under intense selling pressure recently, with Ethereum (ETH) posting its worst Q1 since 2018, sliding more than 45%. That bearish wave swept across the major altcoins — and the Polkadot (DOT) token wasn’t spared either as it declined by 42% this year.
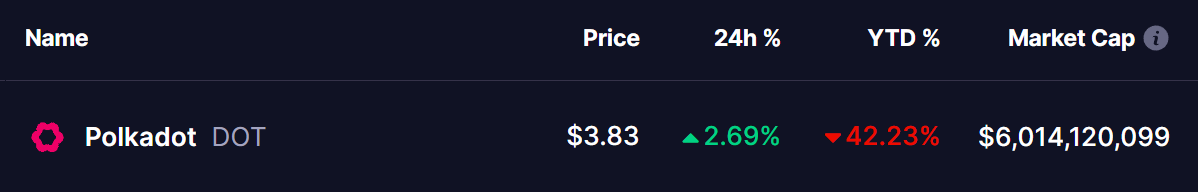 Source: Coinmarketcap
But there’s a shift in momentum brewing as a classic harmonic pattern now hints that a rebound could rise further.
Harmonic Pattern Signals More Upside Move
The daily chart for DOT reveals the formation of a Bearish Gartley Pattern, but as of now, there’s still plenty of upside room left as the token approaches point D to complete the structure.
DOT’s sharp decline began around February 14, after it failed to hold above the $5.37 resistance level (marked as point X). Since then, the token lost nearly 40% of its value, eventually bottoming out near $3.25 on April 7 (point C).
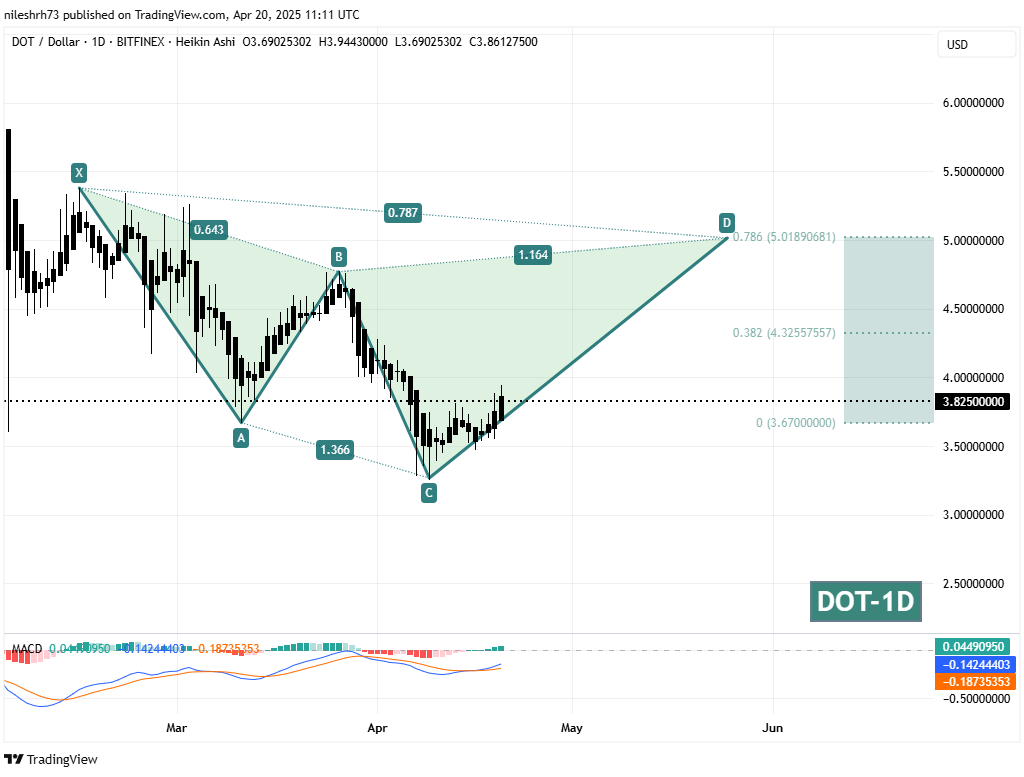 Polkadot (DOT) Daily Chart/Coinsprobe (Source: Tradingview)
However, since hitting that low, DOT has shifted gears, and the recent price action suggests it is now completing the CD leg of the pattern — potentially setting the stage for a continuation of this uptrend.
From here, DOT could extend this rebound toward the final target (point D) of the Gartley pattern, projected at $5.01 — a potential gain of around 30% from the current price near $3.82 if the pattern plays out fully.
What’s Ahead?
Should this bullish momentum continue, traders and investors could watch for a move toward the $5.01 area. This zone represents not just the pattern completion but also coincides with the 78.6% Fibonacci retracement of the X-A leg, a major resistance area where a pullback could occur.
However, caution is still needed as DOT approaches the D point. Bearish reactions typically happen once harmonic patterns complete, meaning profit-taking and volatility could kick in once prices reach the upper target.
For now, the path appears tilted upward, with the $4.32 level (the 38.2% Fib retracement) acting as near-term resistance. A clear break above this zone could further strengthen the bullish setup and push DOT toward its pattern completion target.
Disclaimer: This article is for informational purposes only and not financial advice. Always conduct your own research before investing in cryptocurrencies.