- Ethereum price prediction historically surged after dipping below the lower MVRV Pricing Band.
- A bullish hammer on ETH’s monthly chart signaled a potential rebound toward $2,880.
- ETH/BTC revisited a 2020 support zone, historically a launchpad for major Ethereum rallies.
The current market position of Ethereum price is drawing renewed attention among analysts and traders. When writing, the price of the top altcoin was approaching a historically relevant support zone defined by the Market Value to Realized Value (MVRV) Extreme Deviation Pricing Bands.
This metric has previously coincided with key market reversals. Multiple technical patterns and historical data points signaled a potential shift in the ETH market direction.
Ethereum Price MVRV Bands Signal Historical Buy Zones
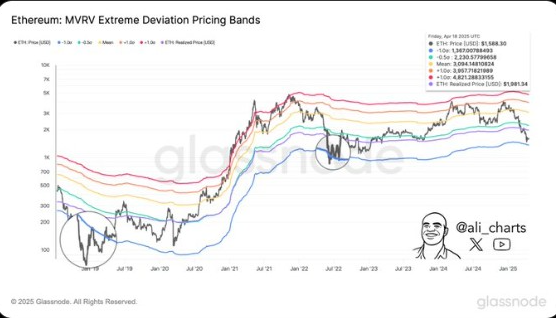
In a recent chart analysis shared by analyst Ali Martinez, Ethereum price was approaching the lower band of the MVRV Extreme Deviation Pricing Bands. These bands are calculated using the MVRV ratio and represent standard deviations from the mean.
The dark blue line in the chart marks the lowest of these bands, associated with historically undervalued levels. According to the chart, ETH price touched this lower band during two periods in the past. The first instance was in late 2018. The second took place around mid-2022.
Strong upward movements followed both periods in price. The latest reading placed the lower band at $1,367, suggesting this area may again act as a support level.
 Source: X
Martinez circled the two past events on the chart. In both cases, ETH price later experienced notable gains. The Ethereum price prediction chart covers the period from early 2018 through 2025, showing the MVRV bands tracking with price changes.
More so, the MVRV approach blends historical pricing with realized capitalization. By comparing market value to the realized value, the ratio helps identify periods of extreme overvaluation or undervaluation.
Technical Signals Point to Potential ETH Price Reversal
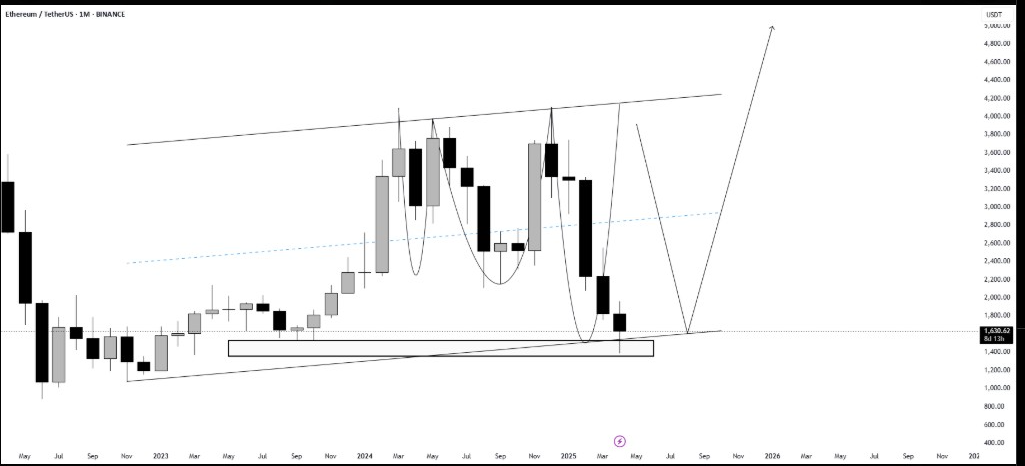
Another chart analysis on the ETH/USDT monthly chart indicated a possible short-term upward movement at press time. The altcoin formed a bullish hammer pattern at the bottom of a long-term descending channel. This pattern often appears near reversal zones, based on prior support tests.
Large wicks below recent monthly candles showed that sellers failed to keep prices low. Buyers seemed to have stepped in around this support level. The zone aligned with past accumulation areas, where trading volume increased. These zones tend to precede price rebounds when similar patterns occur.
 Source: X
The current monthly formation suggests ETH may begin to create higher lows. It is a condition that many technical analysts watch as a sign of structure reversal.
If that happens, the price could aim for resistance zones within the channel. According to the analysis, the top altcoin has a short-term target of $2,880.
ETH/BTC Pairing Revisits Long-Term Support Area
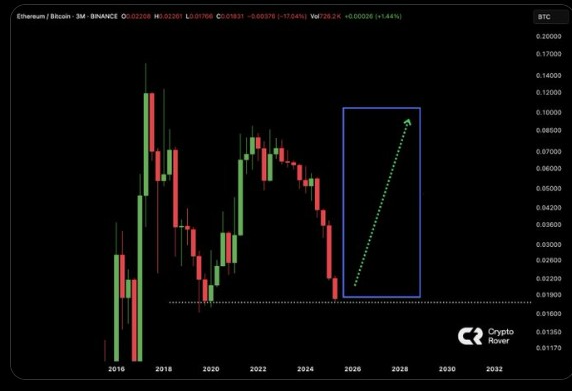
The ETH/BTC chart, as posted by market analyst Crypto Rover, showed Ethereum price approaching a key support level. This support area was last tested in 2020. A horizontal dotted line marked this zone, which aligns with periods where Ethereum began gaining against Bitcoin.
The ETH/BTC chart, which uses quarterly candles, offers a clear view of long-term market trends and accumulation patterns. This extended timeframe helps highlight major cycles that might be missed on shorter charts.
Notably, the most recent quarterly candle touched the lower boundary of a key support zone. Throughout history, ETH/BTC price levels at this point have triggered major bullish trends that might indicate another upward trend is possible.
 Source: X
More so, the provided data period by the analyst extends from 2016 to 2028. It showcases how Ethereum has performed against Bitcoin throughout various market cycles. In previous cycles, ETH achieved these levels before starting sustained upward trend reversals.
Ethereum Price Prediction
The MVRV pricing band at $1,367 remains the nearest historically observed support. ETH price movement was approaching that level at the time of writing. If ETH touches or falls below this band, it would repeat a pattern seen before major upward movements.
The leading altcoin performed strongly in the past 24 hours and climbed by more than 7% to reach $1,700. This surge was backed by an increase in trading volume, which spiked by more than 44%.
The bullish trend was supported by a recent report predicting Ethereum could rally to $10K, driven by Vitalik Buterin’s proposed RISC-V upgrade aimed at boosting efficiency and scalability.