

- Dogecoin is consolidating between $0.1580 and $0.1870 with repeated failed breaks, showing strong liquidity traps on both ends.
- Trader Tardigrade charts a diamond continuation forming above $0.1700, projecting a possible breakout toward $0.2300 soon.
- Price compression near $0.1820 continues while volume fades, increasing the likelihood of directional expansion in coming sessions.
Dogecoin continues to consolidate within recurring price structures, revealing both trap zones and potential breakout formations. The asset’s recent moves have unfolded across short and daily timeframes, offering traders multiple patterns to watch.
Ranges and Reversals Shape 4-Hour Market Action
Technical analyst Trader Tardigrade identified Dogecoin’s recent behavior as “a sequence of false breakdowns and breakouts within tight price ranges.” His analysis of the 4-hour chart revealed two consolidation zones, between $0.1580–$0.1720 and $0.1770–$0.1870, defined by repeated liquidity sweeps at both support and resistance.
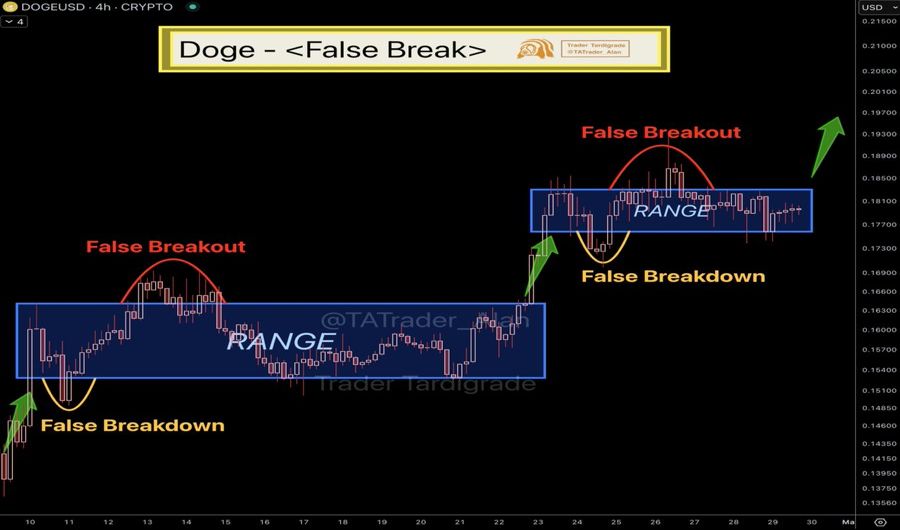
Source: Trader Tardigrade
The first range saw price temporarily exceed $0.1730 before reversing sharply and returning to the zone. A subsequent breakdown below $0.1580 also failed, as DOGE quickly bounced and rallied higher. The same pattern repeated in the second range, where a move above $0.1870 reversed, followed by a drop near $0.1720 that also rebounded.
“These traps flush weak positions and reset liquidity,” he noted while outlining the repetitive structure. DOGE price remains inside the second range, now hovering near $0.1820, with momentum tightening and volume declining. Both zones show price rejection at extremes, building pressure beneath key breakout thresholds.
As volatility compresses, the cycle of trap setups and reversals sets the stage for a directional resolution. Tardigrade concluded that the pattern behavior “often leads to a strong move once both sides have been tested.”
Diamond Continuation Pattern Builds Above Trendline
In his higher-timeframe breakdown, Trader Tardigrade pointed to a diamond continuation forming on the daily chart just above a broken trendline. The pattern, developing between $0.1700 and $0.1880, sits above descending resistance broken on April 23 after DOGE surged past $0.1580.
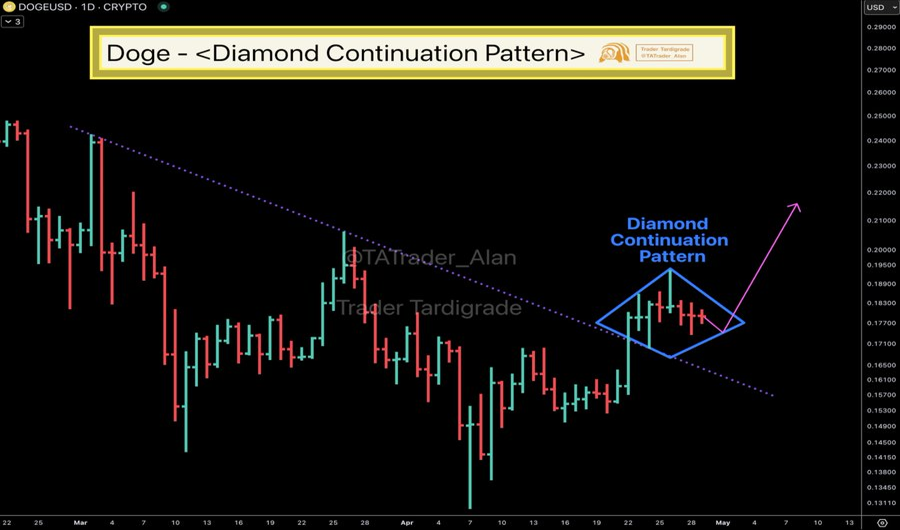
“This is a textbook consolidation after trendline breakout,” he wrote while charting the structure’s symmetrical range. The diamond spans roughly nine sessions, with price rejecting both boundaries but maintaining structural integrity. The setup follows a bottoming move from $0.1340, positioning DOGE inside a potential bullish continuation .
While volume tapers, candles remain inside the pattern, reflecting a pause rather than a reversal. “Wait for the breakout,” Tardigrade advised, mapping a projected move toward $0.2200–$0.2300. With the previous resistance now acting as support, the pattern remains valid until the lower boundary breaks. The pattern’s placement and structure reinforce an underlying trend shift, with DOGE awaiting confirmation above $0.1880.