

-
As HBAR faces a 7% decline this week, the broader crypto market shows signs of slight recovery, highlighting the token’s ongoing struggles.
-
The coin’s performance issues are underscored by its current Relative Strength Index (RSI), indicating a bearish market sentiment.
-
Notably, market analysts emphasize that HBAR’s trading below a critical descending trend line could lead to further price decreases.
HBAR loses 7% this week amidst a recovering crypto market, with bearish indicators suggesting further price decline unless a significant rally occurs.
HBAR Bears Dominate as Selling Pressure Intensifies
An examination of the recent trading patterns reveals that HBAR’s Relative Strength Index (RSI) remains below the critical level of 50, currently measured at 43.38. This downward trend in the RSI serves as a strong indicator of persistent selling pressure, making any recovery efforts appear less likely in the near term.
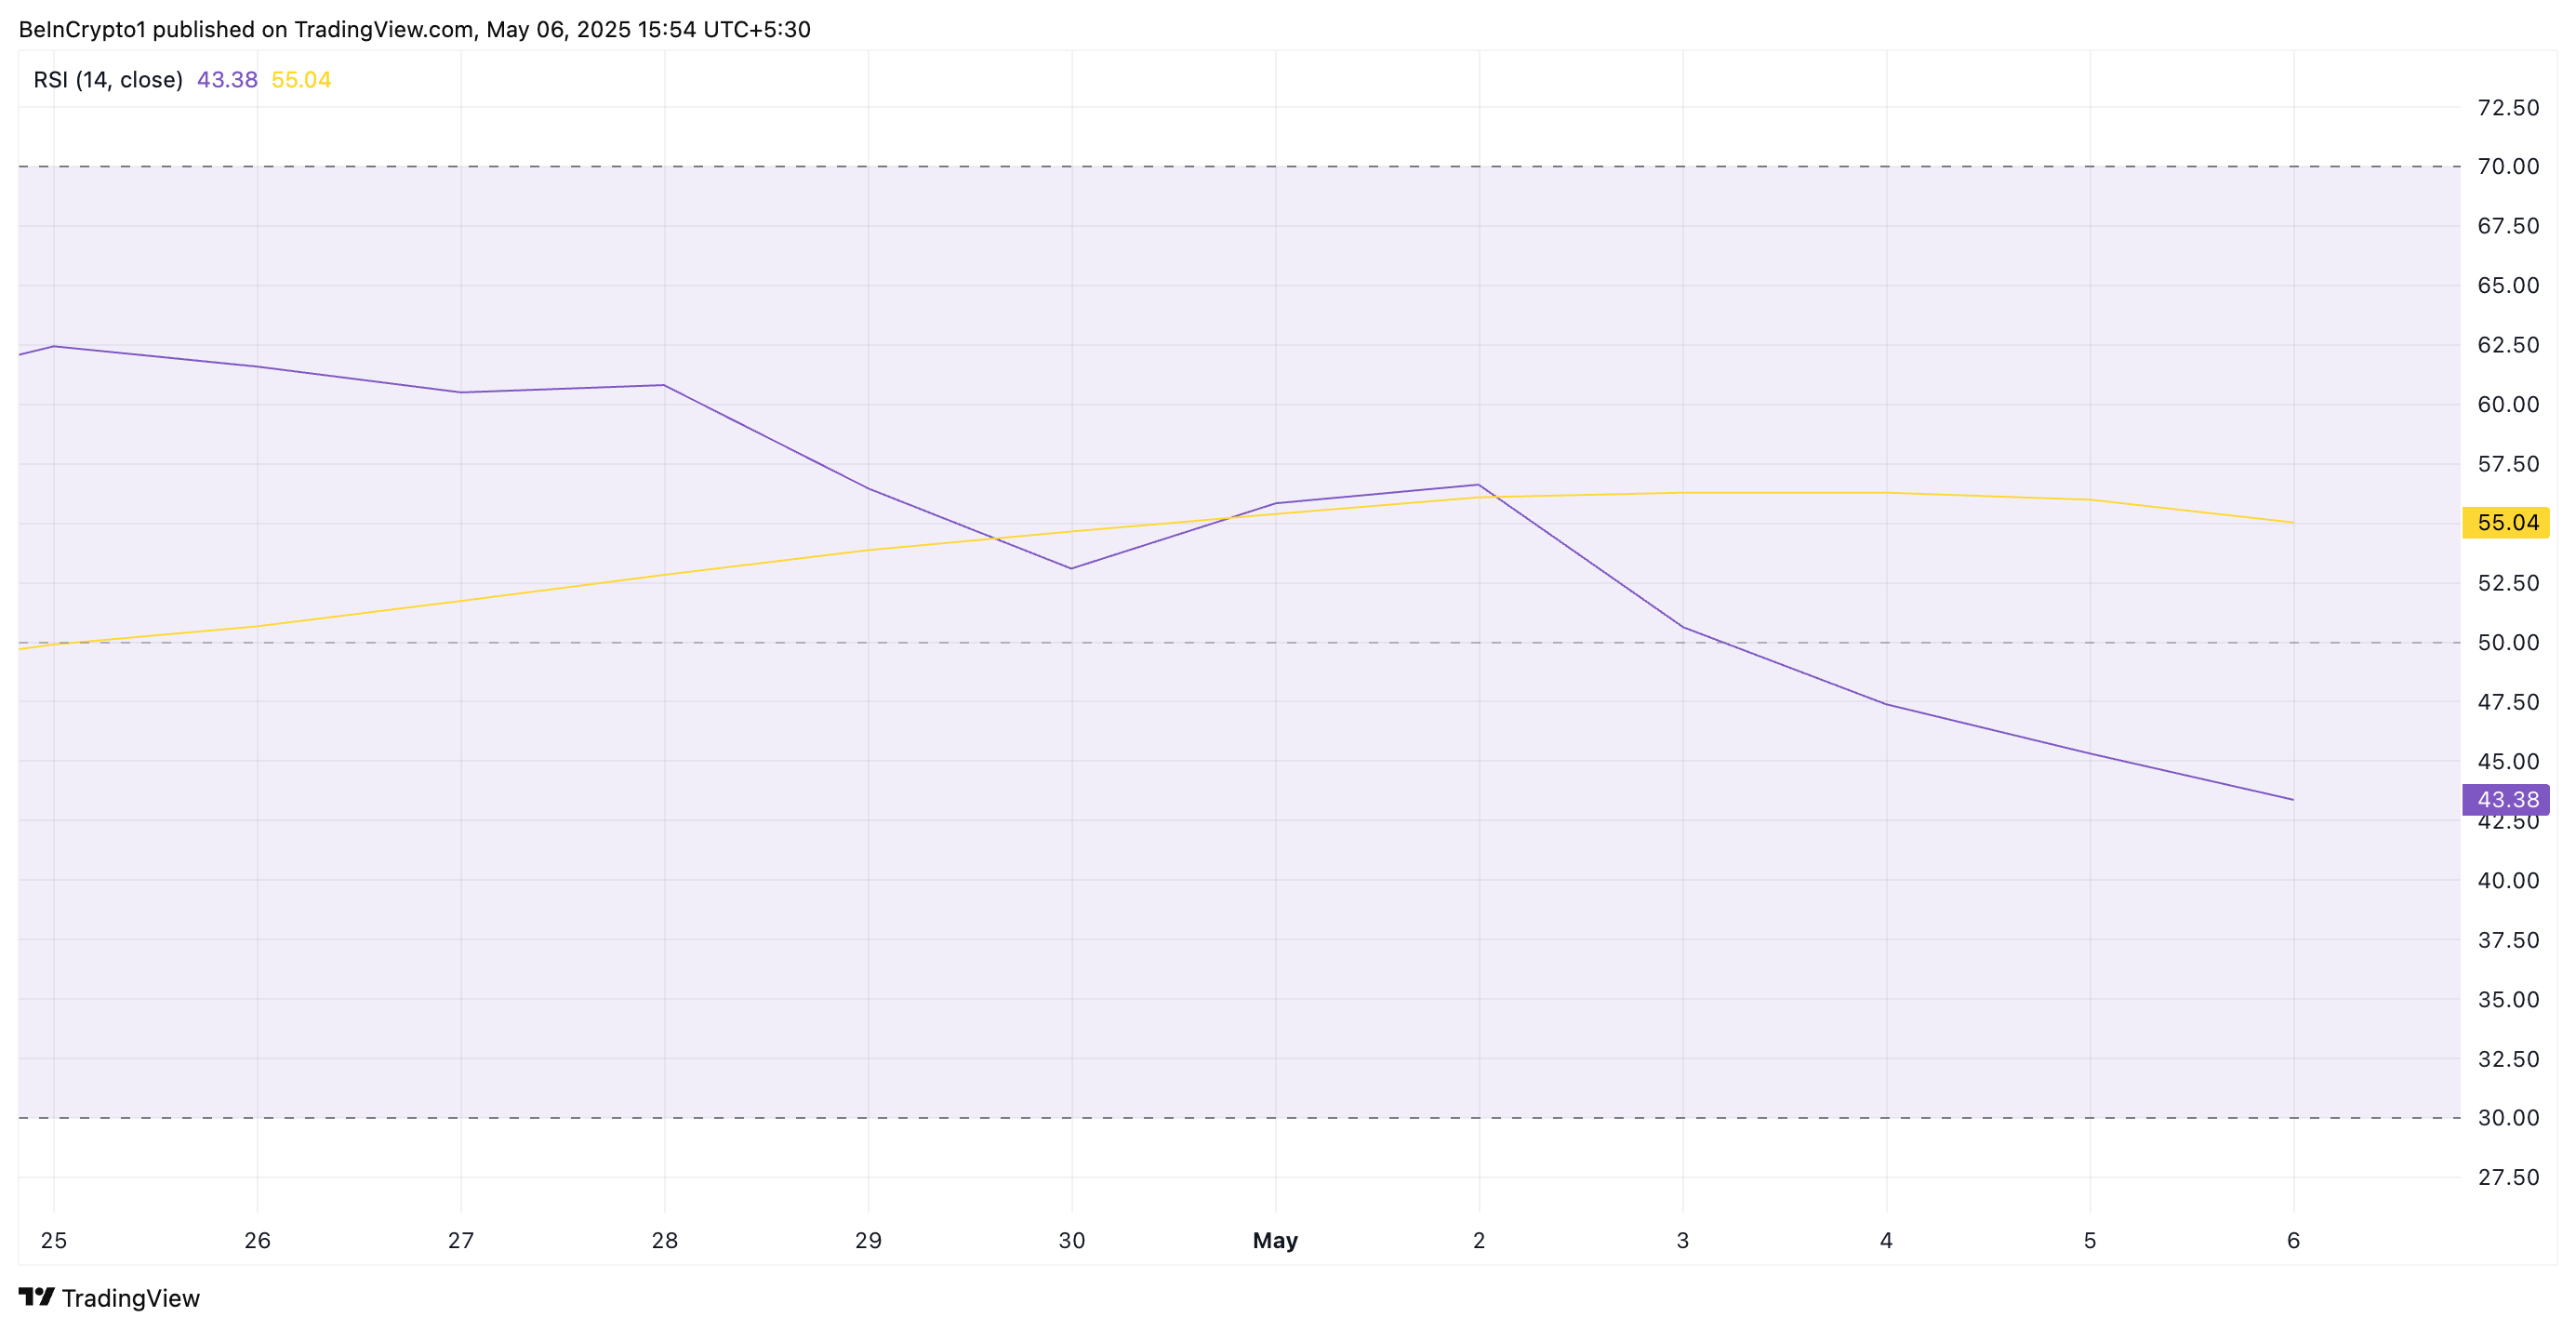
HBAR RSI. Source: TradingView
The RSI, which assesses an asset’s potential overbought or oversold conditions, indicates a worrisome trajectory for HBAR. A sound understanding of this momentum indicator can help traders gauge market sentiment more accurately. The continued depreciation suggests that sellers are overwhelming buyers in the current market climate.
Adding to the bearish outlook is the current reading of HBAR’s Balance of Power (BoP), which stands at a negative -0.27. This indicator serves as a valuable tool in assessing buyer versus seller strength.
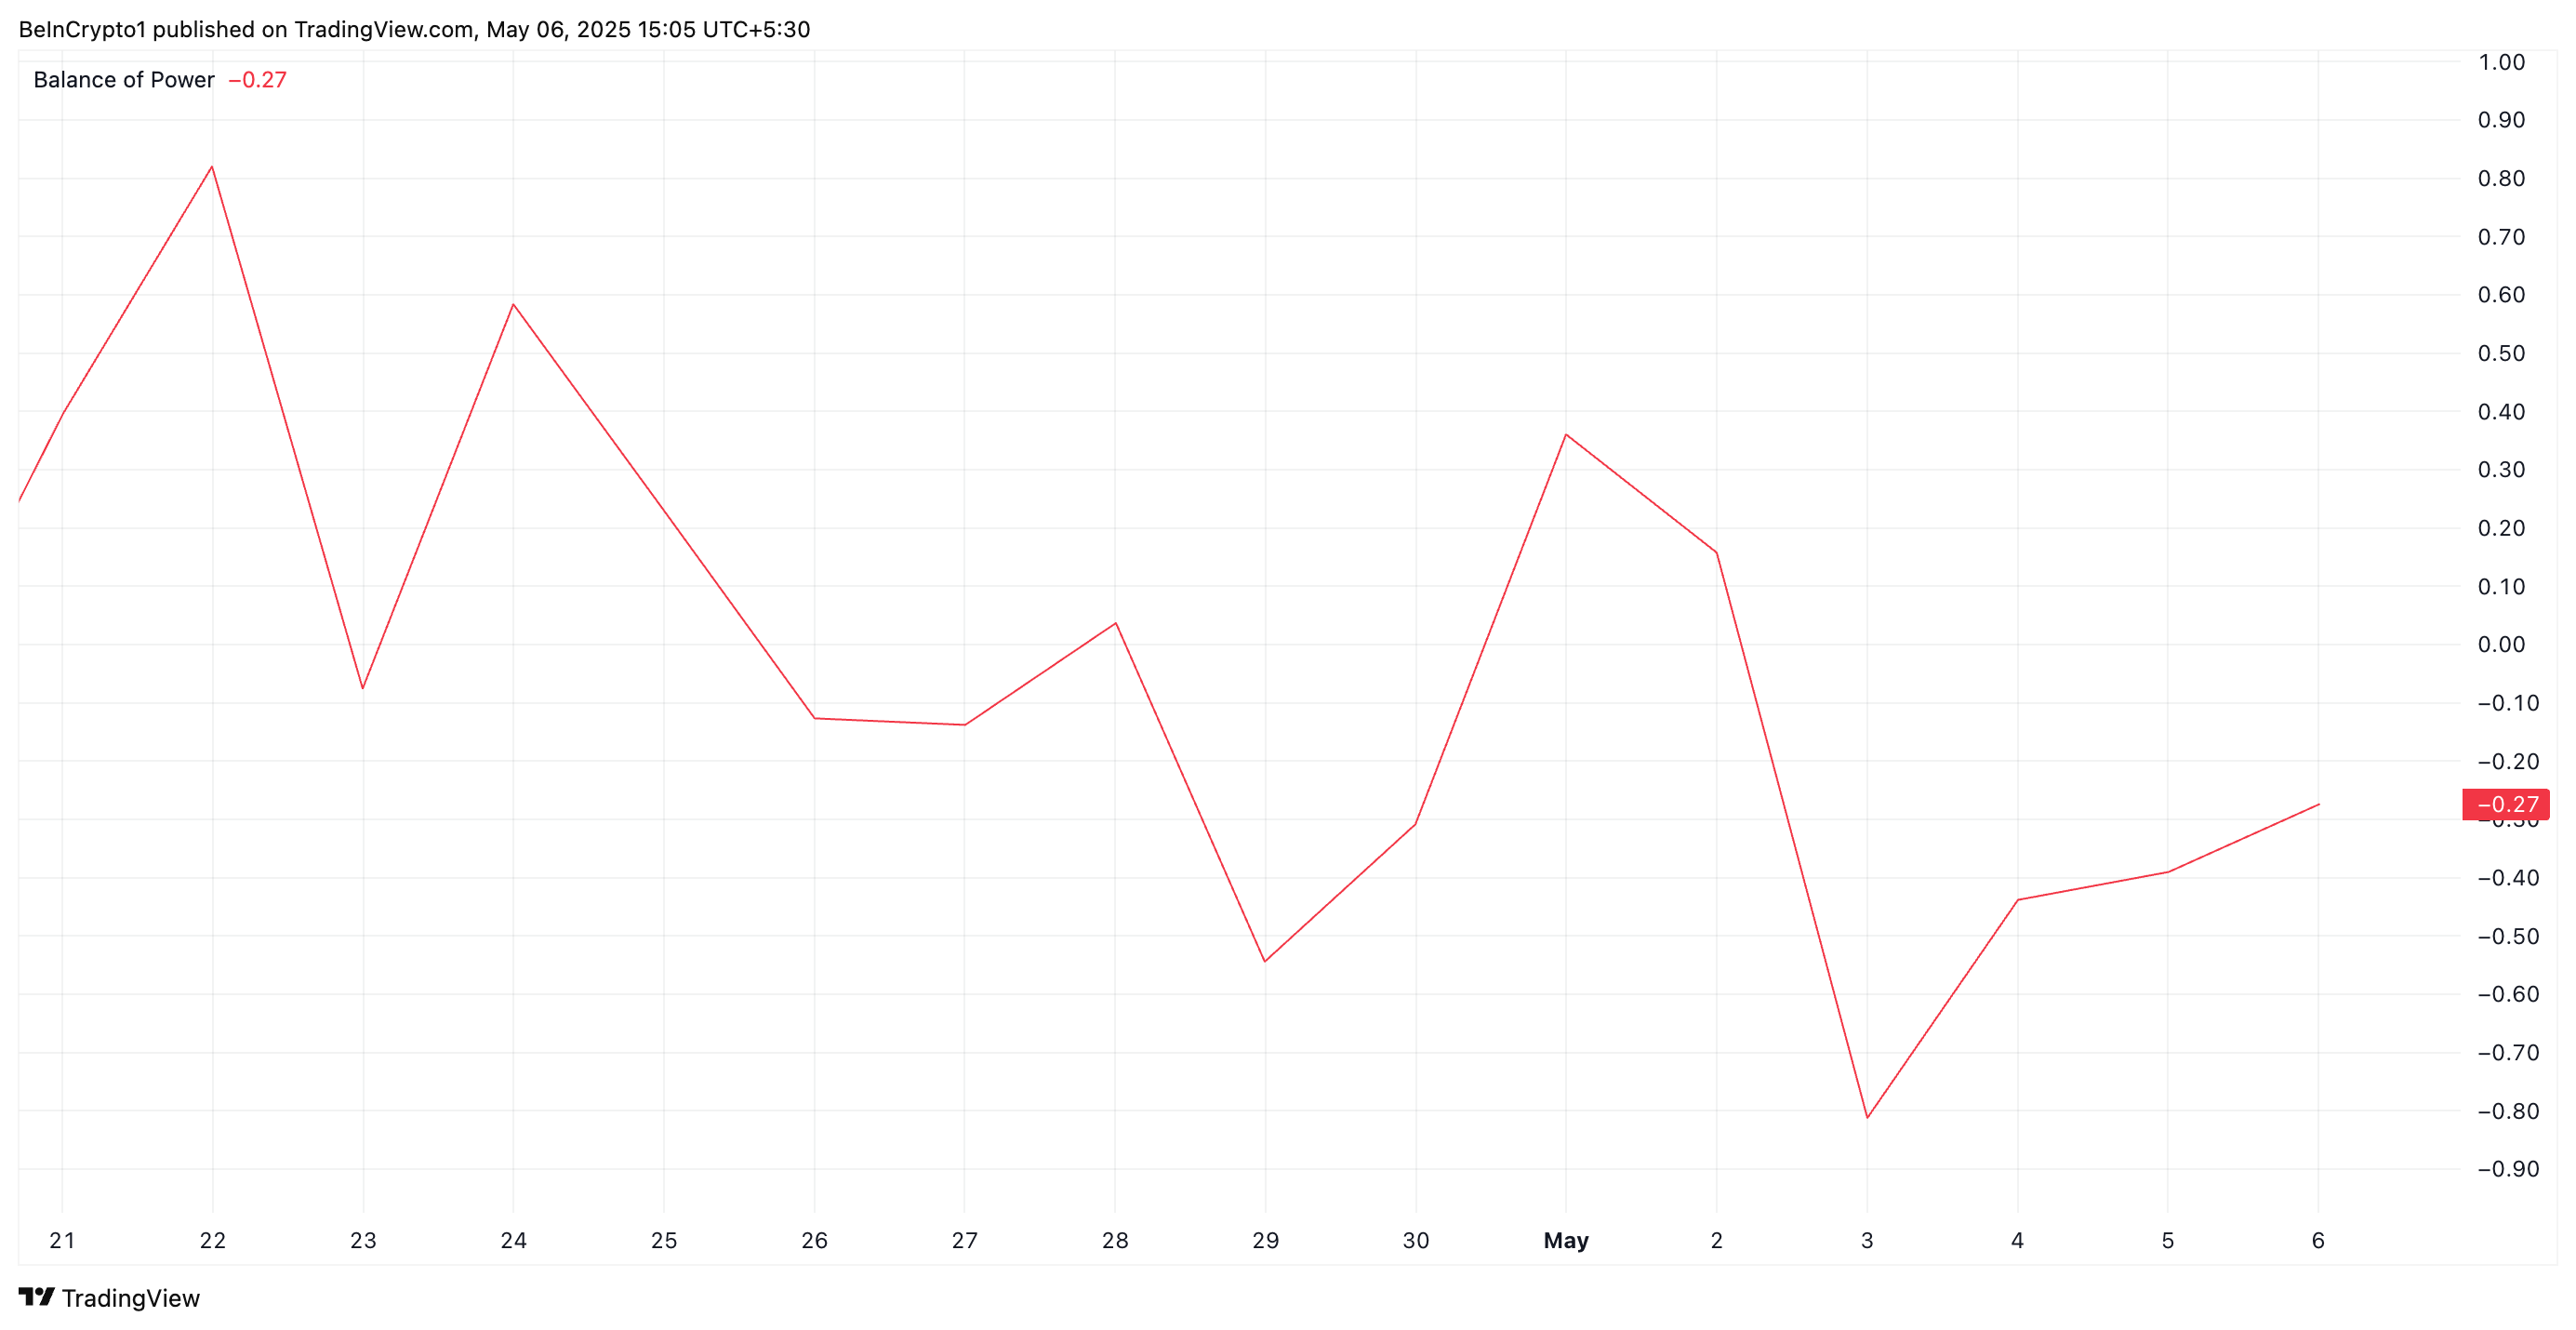
HBAR BoP. Source: TradingView
The negative BoP indicates that the market is firmly in favor of sellers, reinforcing concerns of continued decline in HBAR’s price until there is a shift in market sentiment.
Price Downtrend Escalates for HBAR
The recent downturn in HBAR’s price trajectory has resulted in the token trading below a significant descending trend line, which is often a marker of long-term market weakness. This trend indicates a series of consistent lower highs, suggesting that market confidence could be waning.
If this bearish trend persists, experts predict that HBAR could plummet further, potentially reaching the $0.12 mark. Such a drop could signal to investors that the bearish cycle remains unbroken.
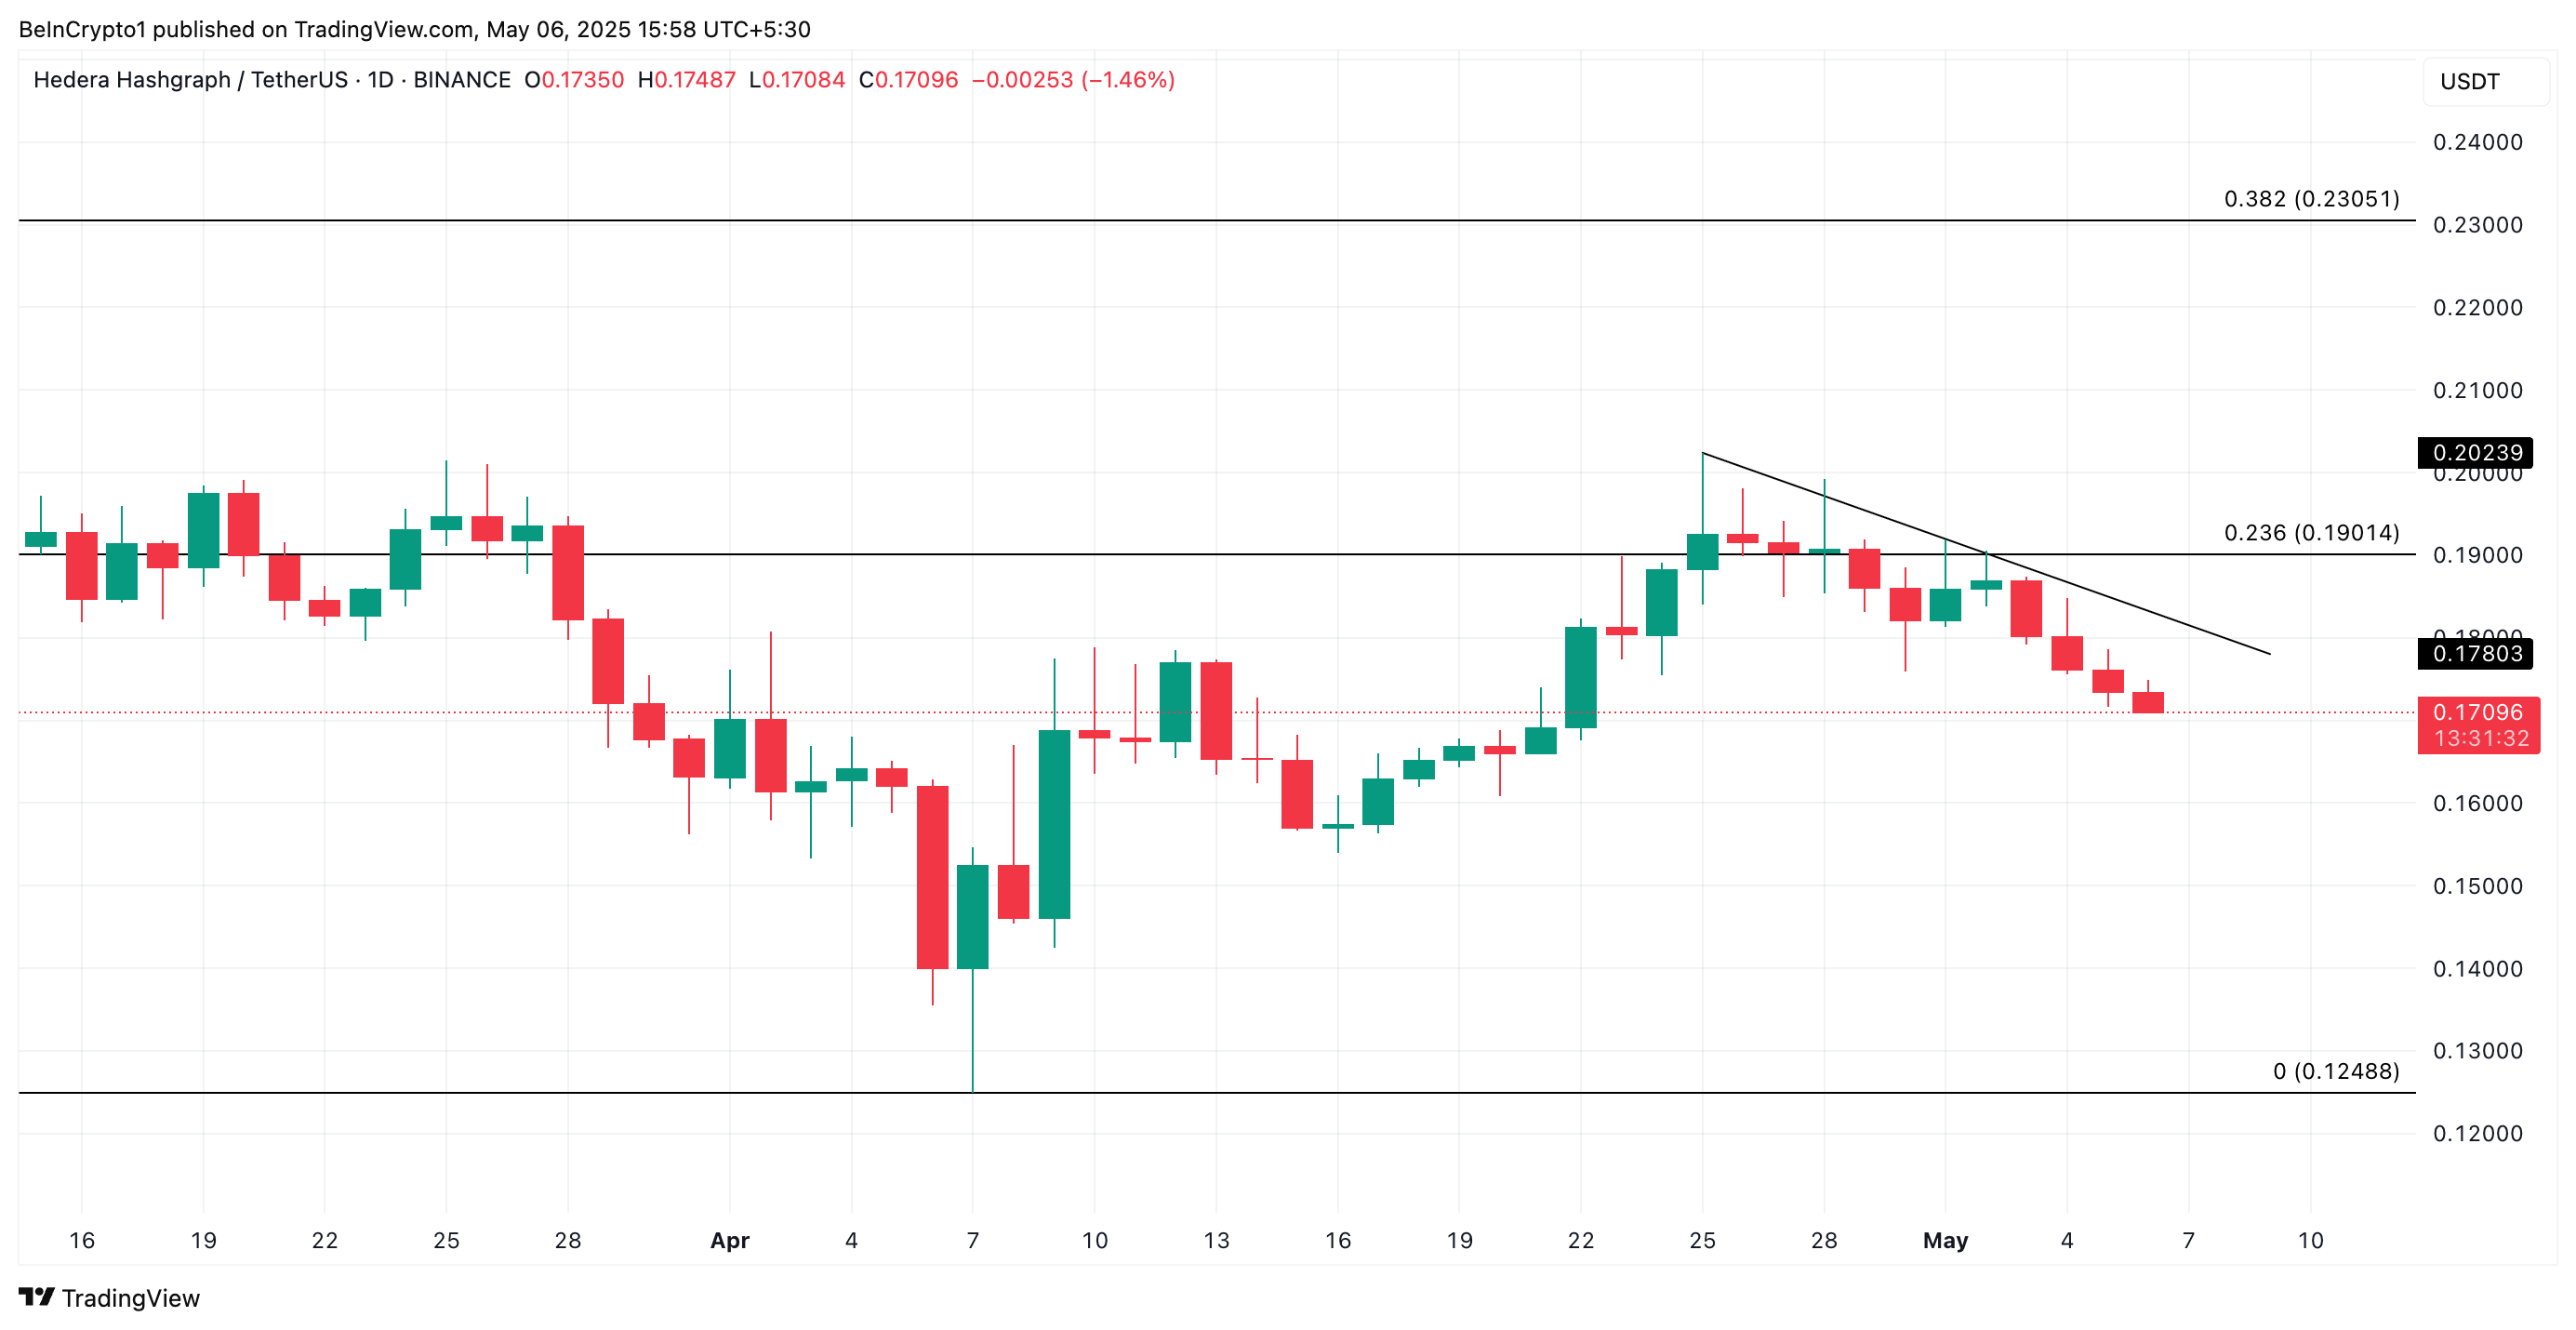
HBAR Price Analysis. Source: TradingView
Nonetheless, should HBAR manage to break above the descending trend line, there may be an upward push in its value potentially targeting $0.19. Traders will be watching closely as price movements unfold.
Conclusion
In summary, HBAR’s recent performance highlights significant bearish sentiment, indicated by its declining RSI and negative BoP. The token’s struggle below the descending trend line suggests that without a substantial upward movement, a further decline to $0.12 is anticipated. Traders are advised to remain vigilant as the market conditions continue to evolve.