

XRP price today remains under pressure after failing to hold above the $2.18 resistance, slipping below key moving averages and testing a critical horizontal demand zone. Despite broader crypto resilience, XRP price action has remained sluggish, with no meaningful breakout since early May. Traders are now eyeing whether the $2.08–$2.10 support can cushion the ongoing slide or if deeper retracements lie ahead.
Trendline Breaks and Consolidation: What’s Happening with XRP’s Price?
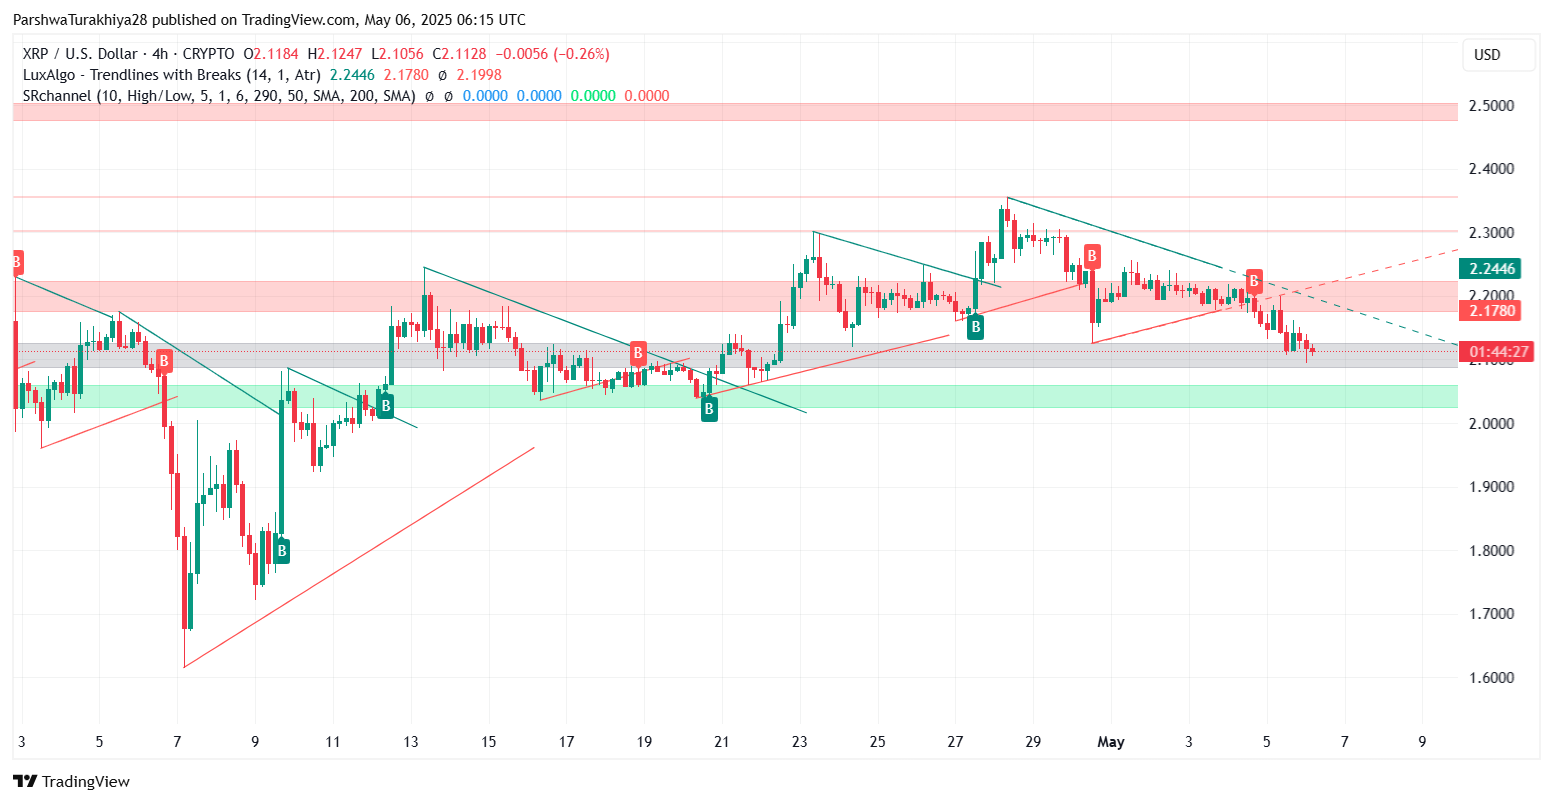 XRP/USD price dynamics (Source: TradingView.)
The XRP price on the 4-hour chart reveals a clear rejection from the $2.24 zone—aligned with both the 0.236 Fibonacci level and the upper Bollinger Band. This rejection was followed by a downward slope beneath the 20, 50, and 100 EMAs, which all converge near $2.17–$2.18, now acting as short-term resistance. A bearish pennant breakdown on the 30-minute chart further accelerates downside pressure, confirming the loss of bullish momentum.
Support between $2.08 and $2.10 is holding for now, bolstered by an earlier demand cluster and the 0.382 Fibonacci retracement (approx. $2.07) from the April impulse move. A breach below this level could quickly push XRP price into the $1.98–$2.00 zone, marking the 0.5 Fib level and next major liquidity zone.
On the upside, a reclaim of the $2.18 mark is required to ease the current bearish bias. Until then, range bound movement within $2.08–$2.18 is the most probable outcome for XRP price today.
RSI and MACD Signal Weakness as XRP Lingers Near Critical Support
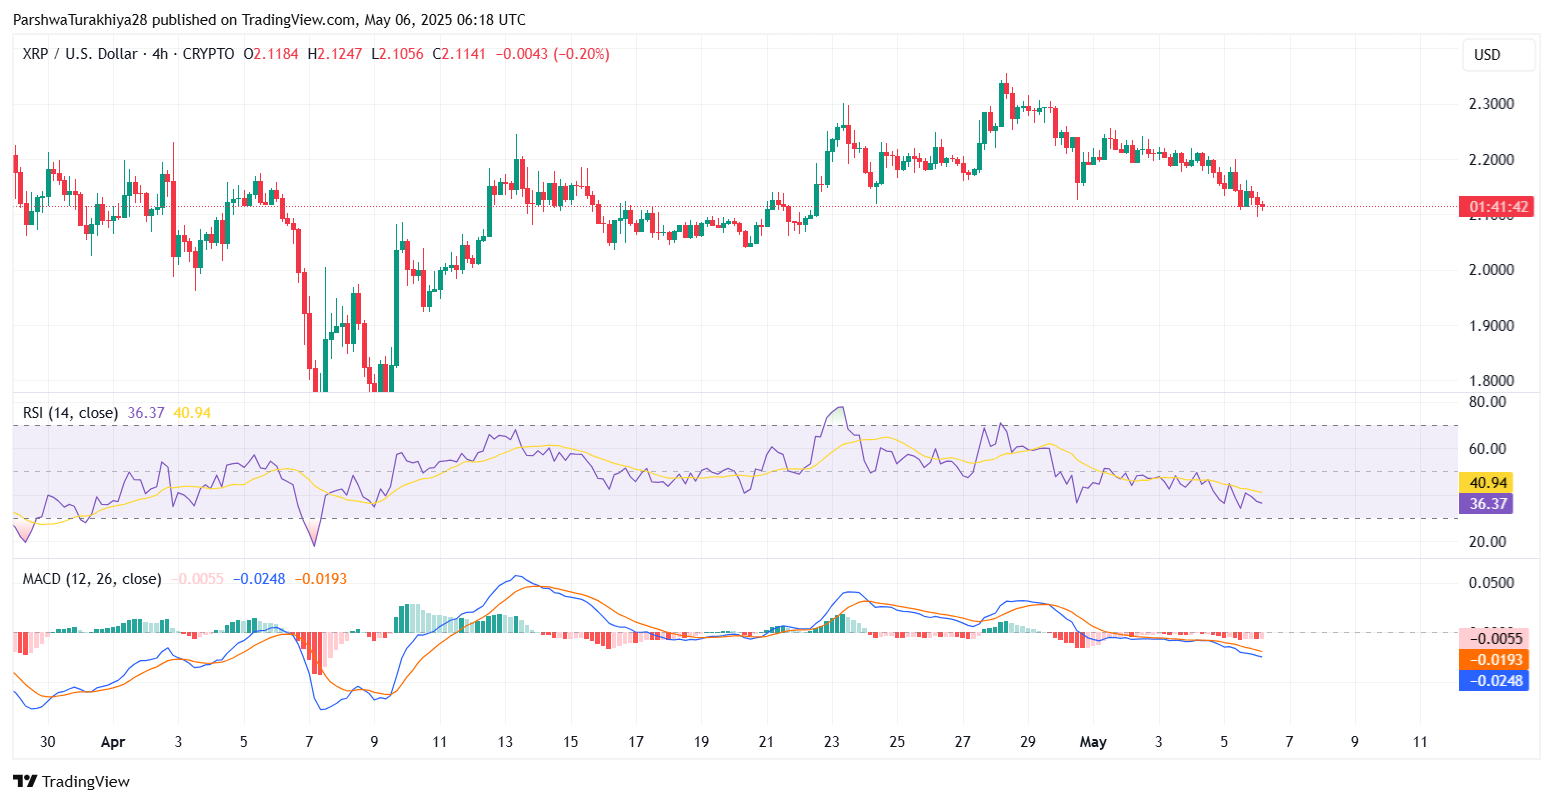 XRP/USD price dynamics (Source: TradingView.)
Momentum indicators on the 4-hour chart highlight prevailing weakness. The RSI reads at 36.37, deep in bearish territory, while the MACD histogram shows persistent red bars with the signal line below zero. These signals align with the broader bearish trend and validate the short-term XRP price volatility.
However, the Stochastic RSI is now hovering around the 20 mark—potentially signaling an oversold condition. This suggests a minor bounce is possible if buyers defend the $2.10 floor, though upside will likely face rejection around the $2.17–$2.18 resistance band.
Bollinger Bands are also tightening, indicating that a volatility expansion is likely imminent. Whether this resolves in a bullish or bearish direction will depend on whether XRP Price can reclaim its EMAs or loses the $2.08 handle.
XRP Price: Fibonacci Levels and Daily Structure
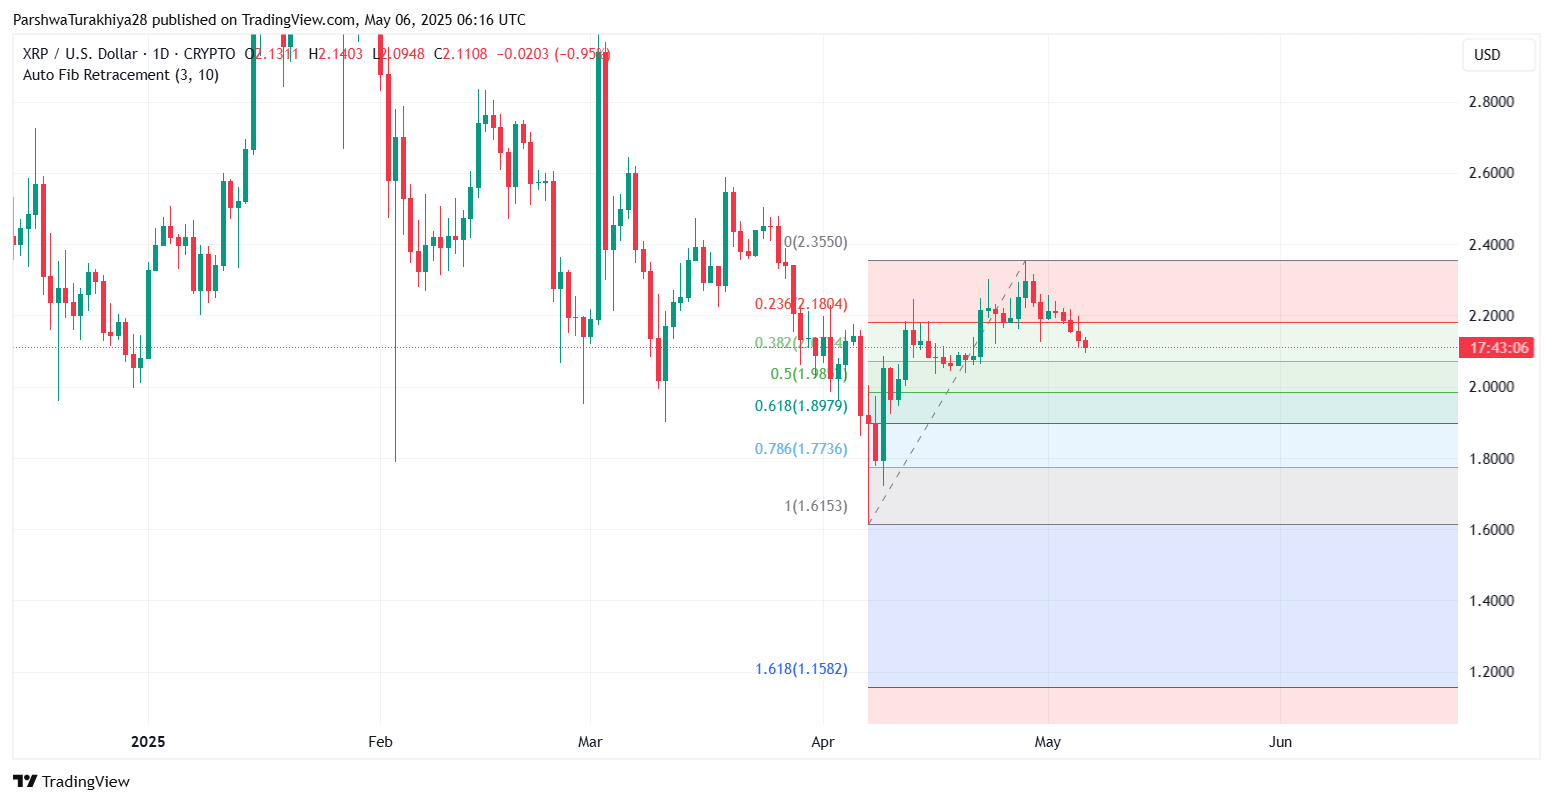 XRP/USD price dynamics (Source: TradingView.)
From a broader perspective, the daily chart shows a textbook rejection from the 0.236 Fibonacci level at $2.18, followed by a slow descent toward the 0.382 and 0.5 levels. The 0.5 Fib ($1.98) and 0.618 Fib ($1.89) remain key zones for any larger correction. These levels coincide with previously tested demand areas during late April and would be watched by swing traders for potential long re-entries.
If why XRP price going down today is the question, the answer lies in the confluence of trendline rejections, EMA failures, and weakening RSI momentum. No clear fundamental news has driven this dip, making the move largely technical.
May 7 Forecast Table for XRP (XRP)
| Scenario | Key Zone | Probability | Commentary |
| Bearish Case | $2.02 – $2.08 | High | Loss of $2.10 support could drive XRP into next Fib zone at $1.98 |
| Neutral Range | $2.08 – $2.18 | Moderate–High | Likely short-term range unless bulls reclaim EMA cluster and horizontal zone |
| Bullish Breakout | $2.20 – $2.24 | Low | Requires strong volume and reclaim above 20/50 EMA and trendline resistance |
Disclaimer: The information presented in this article is for informational and educational purposes only. The article does not constitute financial advice or advice of any kind. Coin Edition is not responsible for any losses incurred as a result of the utilization of content, products, or services mentioned. Readers are advised to exercise caution before taking any action related to the company.