
XRP: Consolidation Under Surveillance – Technical Analysis for May 7, 2025

XRP consolidates after a significant rise. Find our comprehensive analysis and current technical outlook.

In Brief
- Technical analysis XRP consolidates around $2.14 after a sharp rise. The trend remains neutral on moving averages, with momentum declining and a weekly drop of -4.33%, indicating a loss of momentum.
- Key levels: Major resistances are at $2.36, $2.6, and $3, while key supports are at $2, $1.9, and $1.7–1.6. The pivot point at $2.05 remains central for this month’s trend.
- Derivatives analysis: Open interest is stable, with selling dominance on the CVD. Few long liquidations and a neutral funding rate reflect a cautious market under selling pressure.
- Forecasts: Above $2, a return to $2.6 remains possible. In case of a breakout, bearish targets at $1.7 and $1.6 are conceivable. Potential varies between +42% and -32%.
- Macro context: Upcoming economic decisions, notably from the FOMC, could impact XRP’s trajectory and trigger a trend reversal.
XRP Technical Analysis
| Indicator | Status | Comment |
| Spot Price | ≈ $2.14 | XRP stabilizes, trading in a consolidation phase after a previous rise. |
| Latest Weekly Changes | -4.33% | XRP shows a decline, contrasting with the 7% rise recorded the previous week. |
| Latest Weekly Spot Volumes | ≈ 4.2 Billion (-33%) | Spot market activity shows a clear slowdown, indicating a rise in investor caution. |
| Long-term Trend (SMA 200) | Neutral | Neutral structure, very slightly bullish supporting a positive long-term bias. |
| Medium-term Trend (SMA 50) | Neutral | Slightly neutral orientation, reflecting a lack of conviction in the medium term. |
| Short-term Trend (SMA 20) | Neutral | The trend stabilizes, signalling a loss of short-term momentum. |
| Momentum | Decline | Momentum declines following an oscillator rebound. |
XRP stabilizes around $2.14, trading within a consolidation phase after a strong previous rise. Over the week, the cryptocurrency dropped 4.33%, reversing the positive momentum of +7% recorded the week before. This decline is accompanied by a marked decrease in spot volumes, down 33%, reflecting a clear slowdown in activity and increased operator caution. From a technical perspective, long-term and medium-term trends remain neutral with a slightly bullish bias. In the short term, momentum stabilizes, signalling a loss of speed. Momentum itself is declining, with technical indicators pointing toward emerging selling pressure.
XRP Technical Levels
| Indicator | Status | Comment |
| Resistance | $2.36 / $2.6 / $3 | Critical zones, potential distribution thresholds. |
| Support | $2 / $1.9 / $1.7 – $1.6 | Major defense levels, probable accumulation zones. |
| Latest Daily Breakthrough | $1.9 | December support breached; strengthening the bearish bias. |
| Monthly Pivot Point | $2.05 | Reference level for the month’s trend below the price. |
| High Value Area | $2.4 | High volume zone; upper bound of market equilibrium, beyond which imbalance may emerge. |
| Low Value Area | $0.6 | High volume zone; lower bound of market equilibrium, beyond which imbalance may emerge. |
XRP is currently trading above its monthly pivot point ($2.05), supporting a short-term bullish bias despite the recent break of the $1.9 support. Resistances at $2.36, $2.6, and $3 mark potential distribution zones. On the downside, levels at $2, $1.9, and the $1.7–$1.6 area remain key technical supports. The high value area ($2.4) represents a critical threshold: a breakout could trigger a bullish imbalance. The low value area ($0.6) remains an extreme level to monitor only in the event of a major breakdown.
 XRP/USD Daily Chart
The current technical analysis was conducted in collaboration with Elyfe , and 0xhugzer , investors and educators in the cryptocurrency market.
Derivatives Analysis (XRP/USDT)
| Indicator | Status | Comment |
| Open interest | Stable | Exposure stability, no clear signal on speculative commitment. |
| CVD | Selling dominance | Falling CVD, falling price: dominant selling pressure in the market. |
| Liquidation | Low, long side | Slight excess of long liquidations, measured selling pressure. |
| Funding rate | Neutral | Stable funding: no imbalance between buyers and sellers. |
Open interest remains stable, indicating unchanged exposure and lack of strong speculative conviction. The CVD shows selling dominance, with clear selling pressure at market level. Liquidations remain low, mostly long side, indicating moderate selling pressure without excessive leverage. Lastly, the funding rate is neutral, indicating a temporary balance between buyers and sellers. Overall, the technical environment is calm but under seller control.
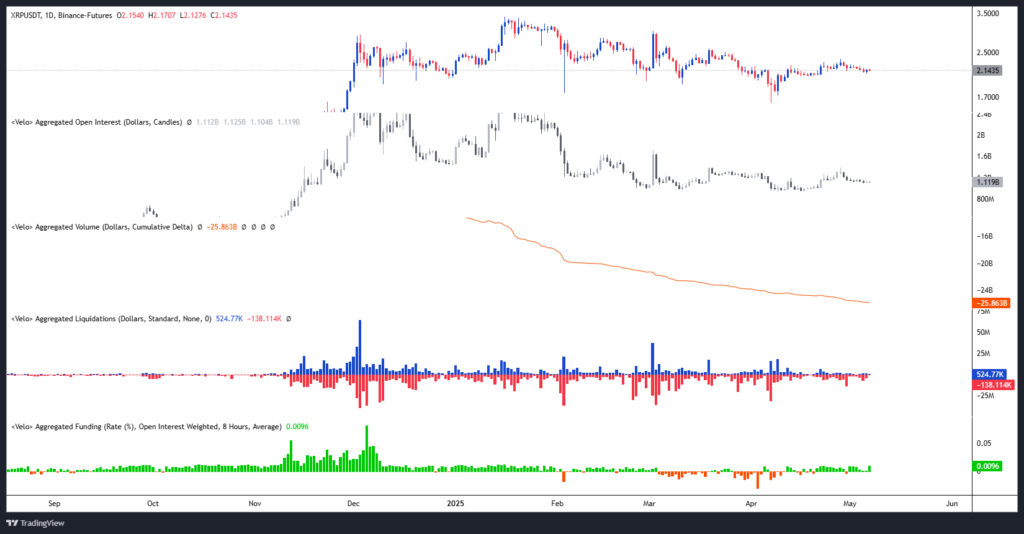 Open Interest / Liquidations / CVD & Funding rate
| Indicator | Status | Comment |
| Sell Liquidation Zone | ≈ 2.17 – 2.28 / 2.37 – 2.44 / 2.5 – 2.7 | Order concentration zones; reaching these levels could trigger volatility acceleration. |
| Buy Liquidation Zone | ≈ 2.07 – 1.97 / 1.70 / 1.62 | Order concentration zones; reaching these levels could trigger volatility acceleration. |
Several selling liquidation zones are identified between $2.17–2.28, $2.37–2.44 and $2.5–2.7, marking concentrations of short orders likely to cause bullish acceleration if breached. Conversely, buy liquidation zones located between $2.07–1.97, then at $1.70 and $1.62 represent fragile points for long positions, which could amplify downward pressure if triggered. These levels constitute potential volatility zones to watch closely.
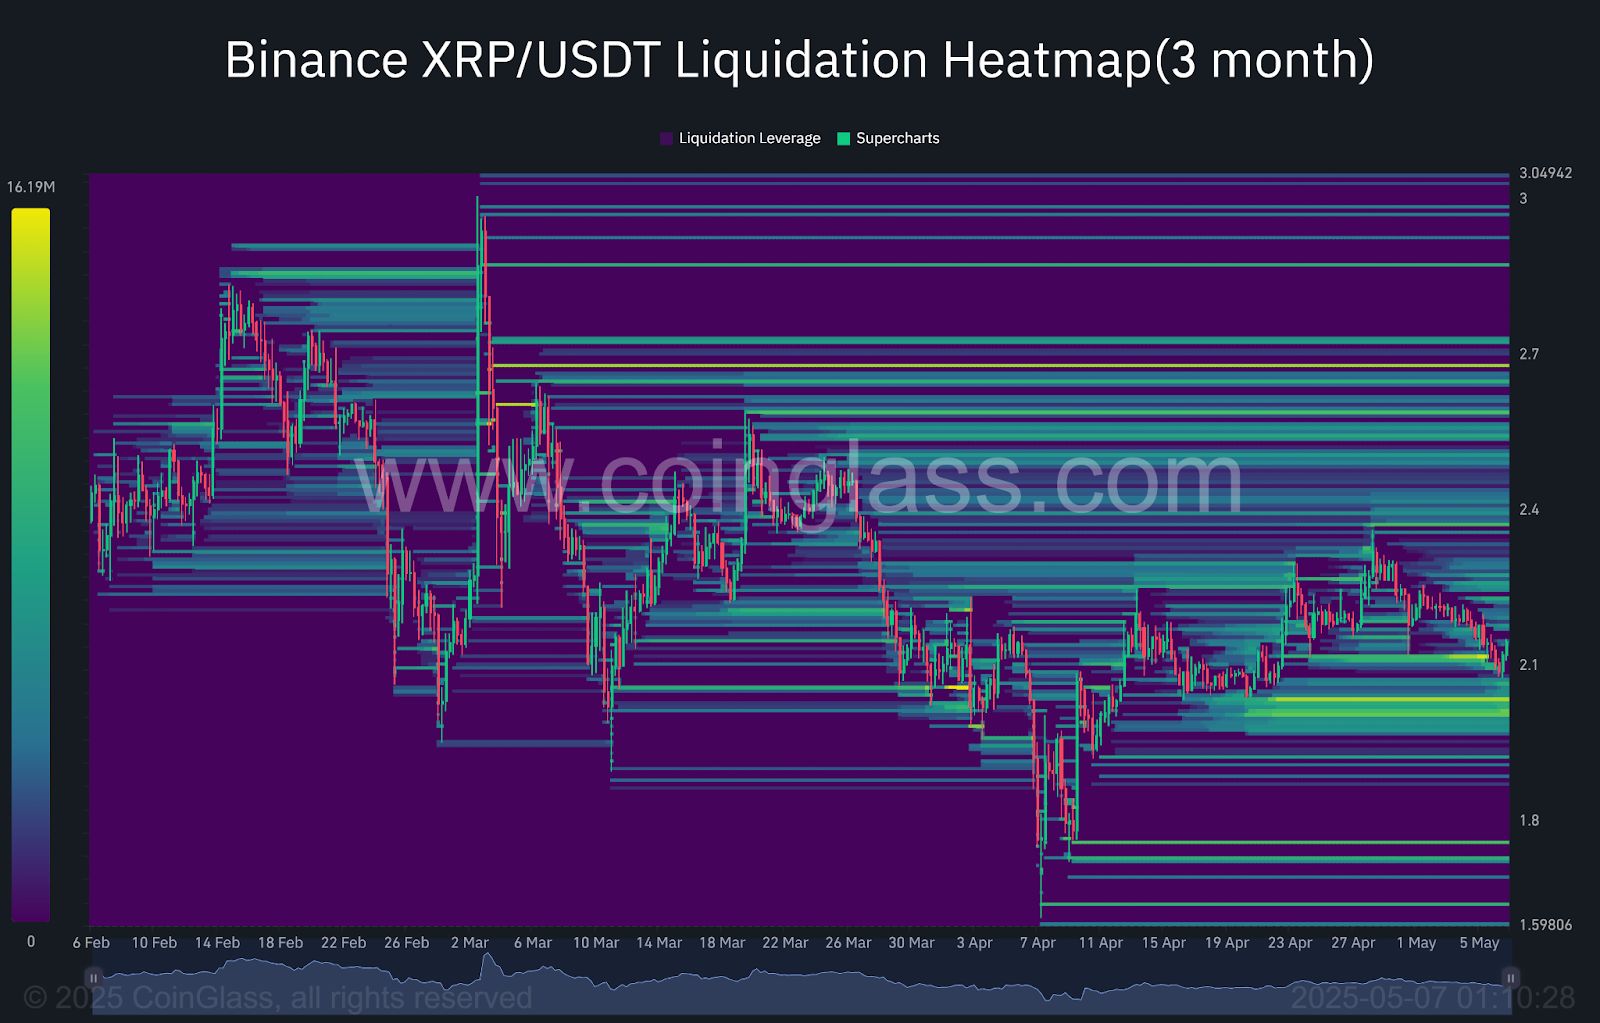 Liquidation Heatmap
Forecasts for XRP Price
Bullish Scenario:
- Conditions: Staying above $2.
- Targets: $2.36 / $2.6 / $3 and beyond.
- Potential: Approximately +42% from the current level.
Bearish Scenario:
- Conditions: Breakdown below $2 support.
- Targets: $1.9 / $1.7 / $1.6 / $1.43.
- Potential: Decline reaching -32%.
Commentary:
The bias remains neutral to bullish as long as XRP holds above its support. Upcoming economic releases, especially those following the FOMC meeting, could mark a decisive directional shift and condition the validation of this scenario.
XRP is currently in a consolidation phase after a strong rally, with momentum showing signs of fatigue. The market remains cautious, within a generally neutral technical context. The trend will now depend on investor reaction to upcoming key price zones, balancing fragile selling pressure and potential recovery. In this context, closely monitoring price reactions at strategic levels will be essential to confirm or adjust current forecasts.
Finally, it is important to remember that these analyses are based solely on technical criteria, and crypto prices can quickly evolve due to other more fundamental factors.
Interested in this study? Discover our latest bitcoin analysis .
Disclaimer: The content of this article solely reflects the author's opinion and does not represent the platform in any capacity. This article is not intended to serve as a reference for making investment decisions.
You may also like
PoolX - Unique PUMP Event: Stake SOL for a Chance to Win a 10% Earn APR voucher
ESUSDT now launched for futures trading and trading bots
New spot margin trading pair — CROSS/USDT, TAC/USDT!
Subscribe to TANSSI Savings and enjoy up to 15% APR