Uniswap (UNI) To Rise Further? Key Harmonic Pattern Signals Potential Upside Move

Date: Thu, May 08, 2025 | 04:48 PM GMT
The cryptocurrency market continues to build on its recent strength, with Ethereum (ETH) leading the charge. ETH has climbed more than 37% over the past month and is now trading near the $2050 mark — its highest level in months. This resurgence is also helping to lift sentiment across major altcoins , including Uniswap (UNI) which was lagging behind. Now, it looks ready to catch up.
The token surged over 15% today, and a classic harmonic pattern on its chart is hinting that a short-term rebound might be around the corner.
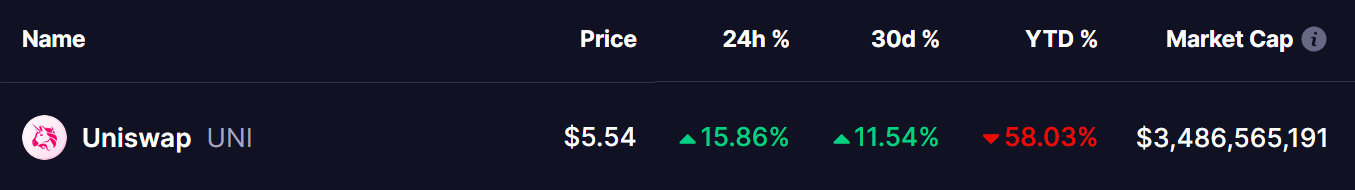 Source: Coinmarketcap
Harmonic Pattern Signals More Upside
On the daily chart, UNI is currently forming what appears to be a Bearish Gartley harmonic pattern — a technical formation often used to identify potential reversal zones when the final leg (CD) completes.
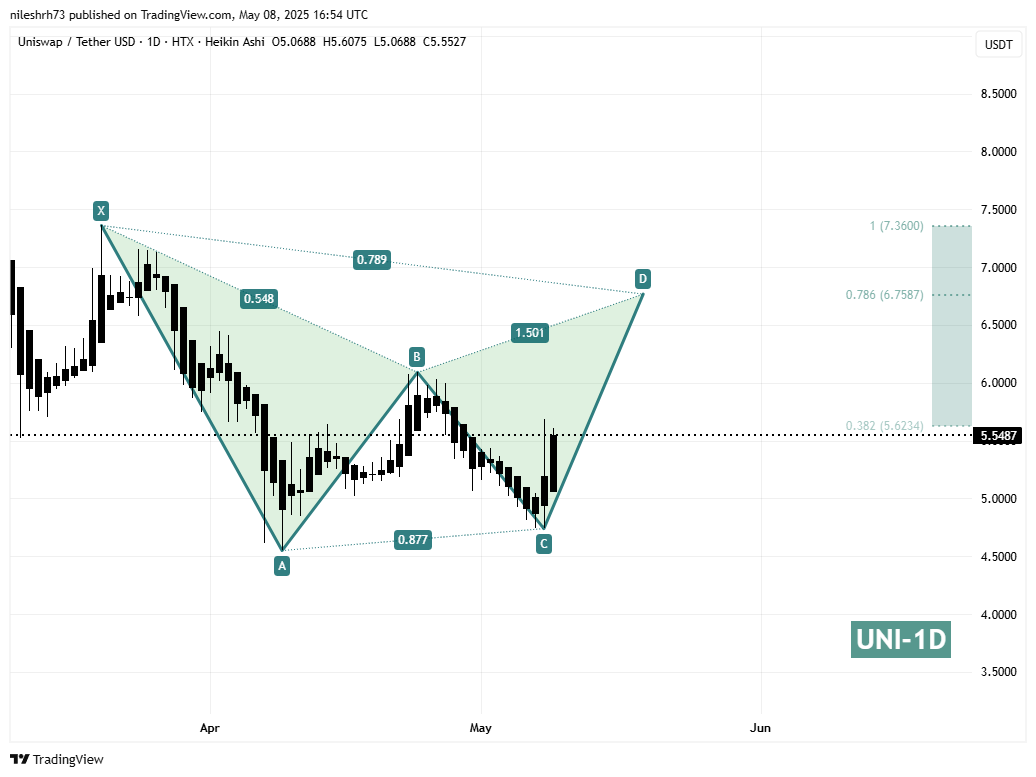 Uniswap (UNI) Daily Chart//Coinsprobe (Source: Tradingview)
The downtrend began around March 20, when UNI failed to stay above the $7.36 resistance level (marked as point X). From there, the price dropped over 38%, bottoming out near $4.55 on April 9 (point A).
The AB leg retraced about 54.8% of the XA move — a textbook retracement for a valid Gartley. Then, after a strong retracement on the BC leg (~87.7%), UNI bounced again from the C point low near $4.74. Now, UNI is pushing higher and seems to be on track to complete the CD leg — heading toward the critical D point.
What’s Next for UNI?
If the Gartley harmonic pattern plays out as expected, UNI could rally to $6.75, which aligns with the 78.6% Fibonacci retracement of the initial XA leg. This would imply a potential 21.90% upside from its current price around $5.55.
However, there’s more at stake. Should buyers manage to break above the $6.75 resistance, the price could revisit the previous swing high near $7.36 — opening the door for a 32%+ rally from today’s level.
This upper target zone also aligns with the D point, typically a reversal or consolidation area in harmonic patterns. Therefore, traders should be cautious — while the momentum is bullish, some profit-taking may occur near that resistance band.
Disclaimer: This article is for informational purposes only and not financial advice. Always conduct your own research before investing in cryptocurrencies.
Disclaimer: The content of this article solely reflects the author's opinion and does not represent the platform in any capacity. This article is not intended to serve as a reference for making investment decisions.
You may also like
Announcement on the completion of pump.fun (PUMP) Token Sale
Update on the pump.fun (PUMP) Token Sale Results
[Initial Listing] Bitget Will List PrompTale AI (TALE). Come and grab a share of 3,480,000 TALE
New spot margin trading pair — LA/USDT!