Stellar (XLM) Gains Momentum Following Key Breakout – Is a Rally on Horizon?

Date: Fri, May 09, 2025 | 04:15 AM GMT
The cryptocurrency market continues to build on its recent strength, with Bitcoin (BTC) and Ethereum (ETH) leading the charge. In the past 24 hours, BTC has crossed the $102K mark while ETH has surged more than 15% and is now trading above $2200 — its highest level in months. This bullish momentum is also lifting the sentiment across major altcoins , including Stellar (XLM).
Stellar has jumped over 8% today, bringing its monthly gains to 34%. Now, the latest price action suggests there could be more upside ahead.
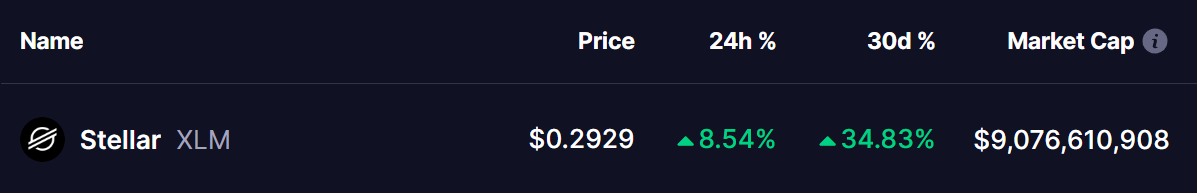 Source: Coinmarketcap
Falling Wedge Breakout Signals Reversal
Looking at the daily chart, XLM had posted a remarkable rally of over 575% back in late 2024. After peaking at $0.63 on November 24, the altcoin entered a strong corrective phase. During this period, it formed a falling wedge pattern, which pulled the price down by nearly 68%, reaching a low of $0.20 on April 7, 2025.
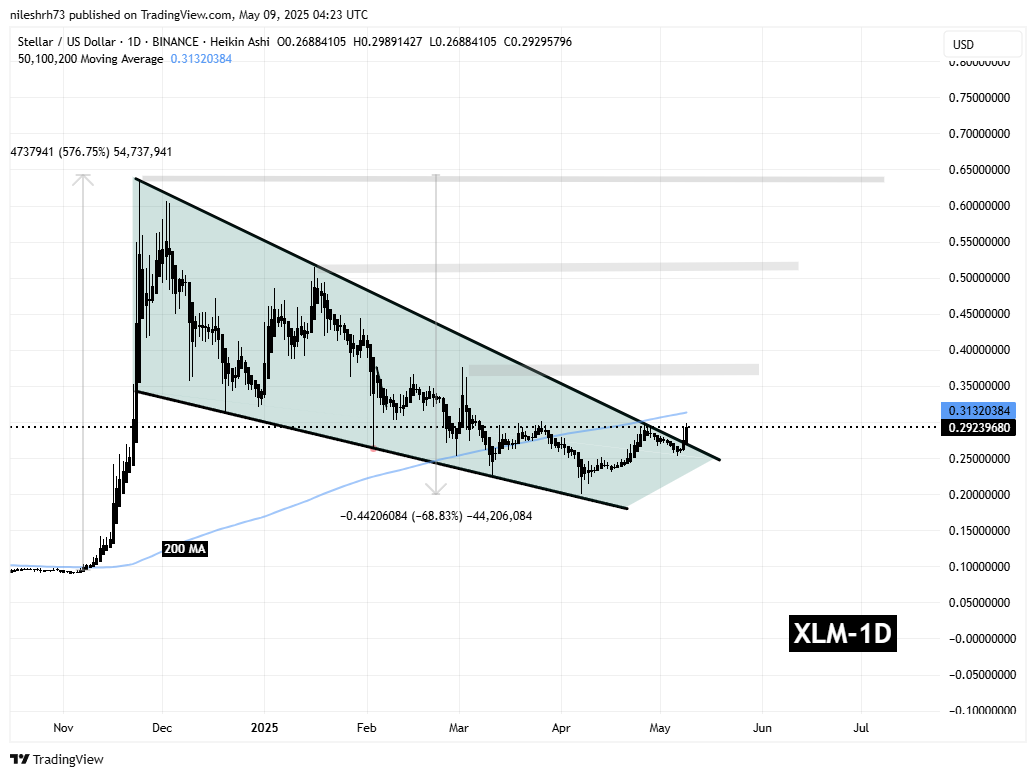 Stellar (XLM) Daily Chart/Coinsprobe (Source: Tradingview)
Since then, Stellar began showing signs of a reversal. The key moment came today when XLM successfully broke out of the falling wedge pattern, a bullish indicator that typically signals the end of a downtrend and the beginning of a new upward movement. The breakout took place near the $0.27 mark, as the price moved above the descending resistance trendline.
Following the breakout, XLM surged to $0.29 and is now testing the 200-day moving average — a crucial level that often determines long-term trend direction.
What’s Next for XLM?
From here, if Stellar manages to close firmly above the 200-day moving average, currently around $0.31, it could spark a strong rally. The next key resistance levels lie at $0.37, followed by $0.51 and ultimately the previous high near $0.63. Reaching that top level would mark a 117% increase from the current price, offering a potentially rewarding upside for traders and investors.
However, if the price fails to sustain above the 200-day MA and faces rejection, a short-term pullback toward the breakout level around $0.27 could occur. This would not necessarily be bearish, as a retest of the breakout zone could offer a solid opportunity for buyers to re-enter before another leg higher.
Disclaimer: This article is for informational purposes only and not financial advice. Always conduct your own research before investing in cryptocurrencies.
Disclaimer: The content of this article solely reflects the author's opinion and does not represent the platform in any capacity. This article is not intended to serve as a reference for making investment decisions.
You may also like
Announcement on the completion of pump.fun (PUMP) Token Sale
Update on the pump.fun (PUMP) Token Sale Results
[Initial Listing] Bitget Will List PrompTale AI (TALE). Come and grab a share of 3,480,000 TALE
New spot margin trading pair — LA/USDT!