
Buy or Bail? IOTA Flashes Major Bullish Signal

IOTA (MIOTA) has suddenly re-entered the spotlight with an impressive +7% rally in the last 24 hours. As bullish sentiment spreads, traders and long-term investors are asking—is this breakout sustainable, or is IOTA at risk of another pullback? A close look at both the daily and hourly charts reveals several key indicators of where the token could be headed next.
IOTA Price Prediction: Multi-Month Resistance Breached
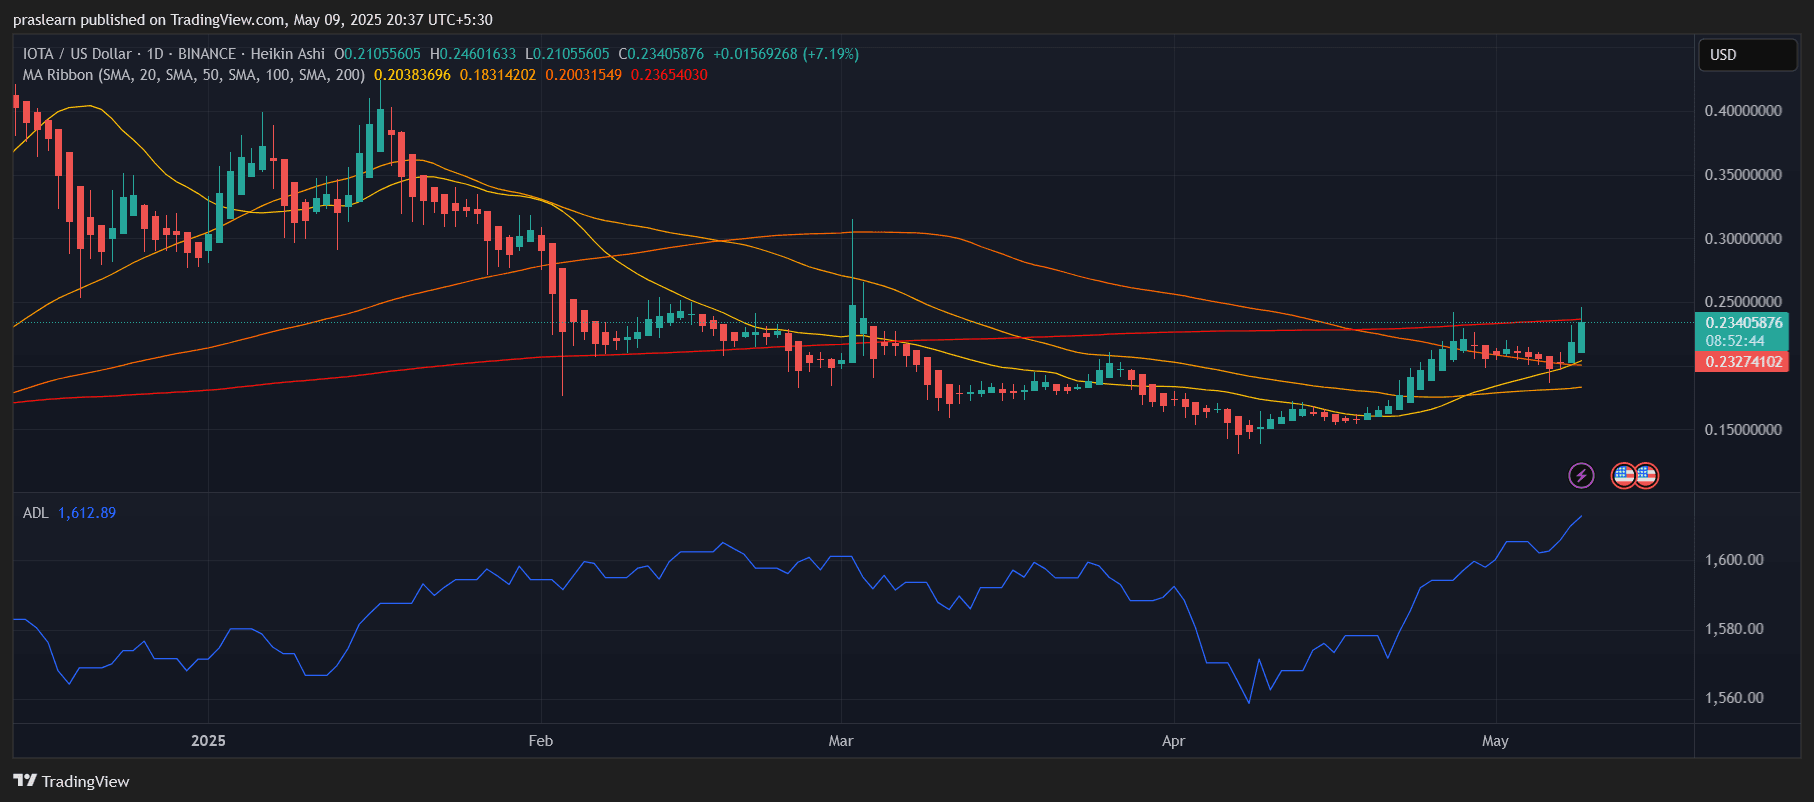 IOTA/USD Daily Chart- TradingView
The daily chart paints a clear technical picture : IOTA price has decisively broken out of a prolonged consolidation range between $0.20 and $0.23. After weeks of sideways trading, today’s breakout candle has surged above the 50-day and 100-day moving averages, both of which had previously acted as strong dynamic resistance.
What’s more critical is IOTA’s interaction with the 200-day simple moving average (SMA), currently near $0.2365. This level is not just psychological—it’s also where price faced rejection during February’s brief rally. Now that IOTA has pierced this threshold again, a confirmed daily close above $0.24 would flip the long-term trend to bullish.
The Heikin Ashi candle structure reflects rising momentum with strong consecutive green bodies and little-to-no lower wicks—suggesting trend strength and continued buyer pressure.
From a volume perspective, the Accumulation/Distribution Line (ADL) has been rising since mid-April, confirming steady capital inflows. Unlike previous fakeouts, this price surge appears to be fundamentally supported by real buying activity.
If the bullish momentum holds, the next visible resistance zone lies between $0.26 and $0.30, a historical region of congestion from the early 2023 structure.
IOTA Price Prediction: Near-Term Momentum Cooling, but Structure Remains Bullish
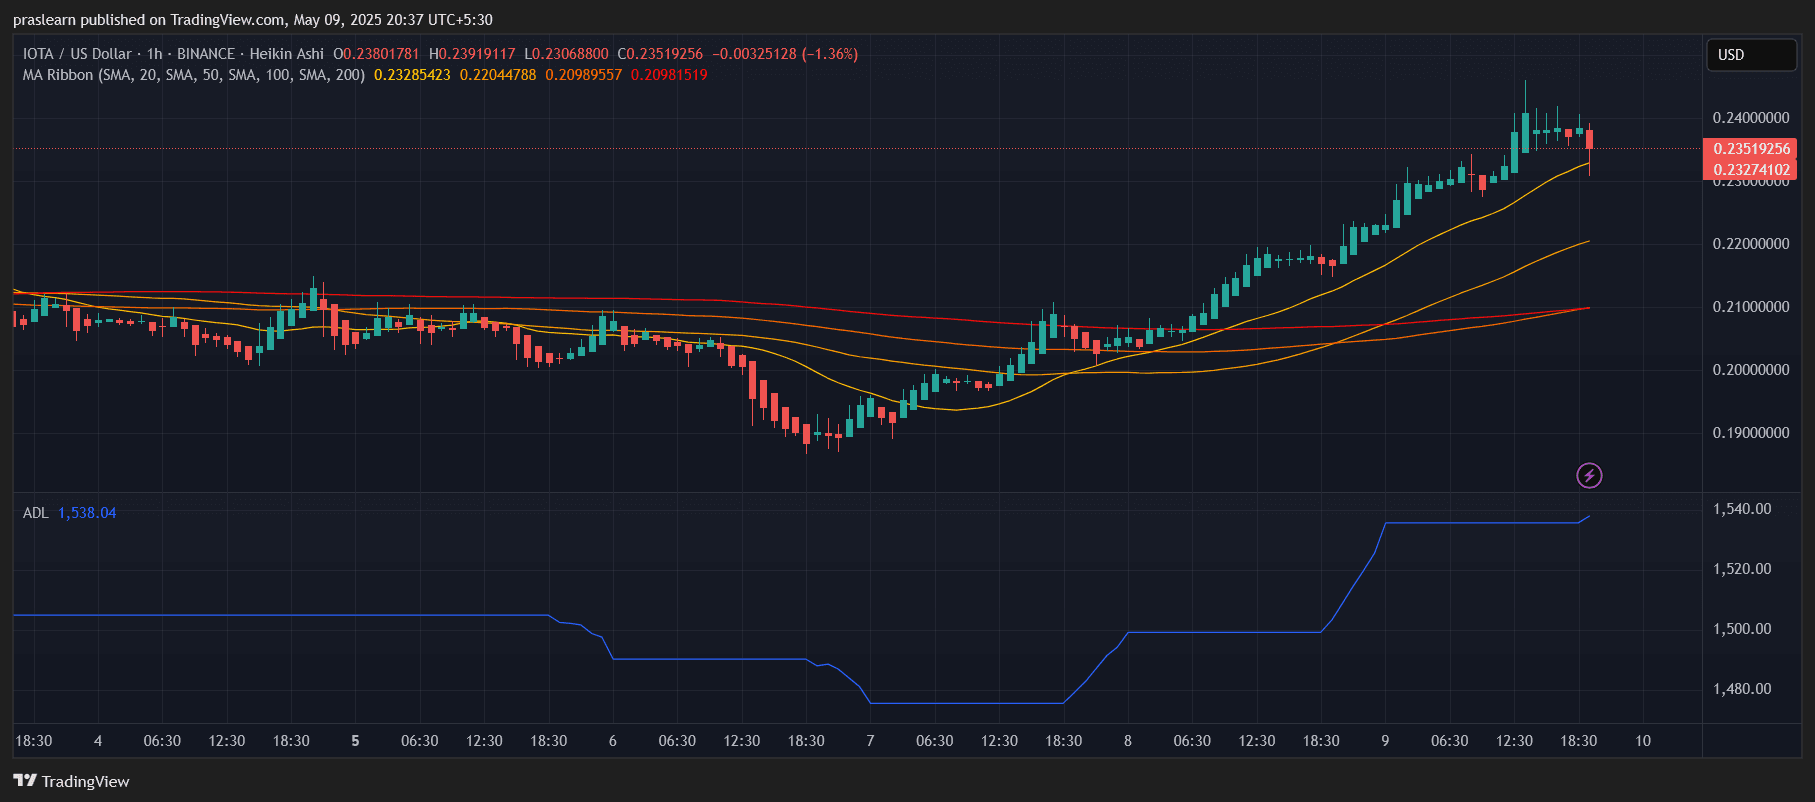 IOTA/USD 1 hr Chart- TradingView
Zooming in to the hourly chart, we see that IOTA price hit an intraday high of $0.2460 before facing immediate selling pressure. However, the pullback is healthy and expected, given the rapid climb.
Crucially, the 20, 50, and 100-hour moving averages are all sloped upward and are stacked in bullish order—a textbook setup of short-term trend strength. The price is still holding above the hourly 20-SMA, with the $0.232–$0.235 zone acting as the first strong support.
Even though Heikin Ashi candles show minor cooling in the last couple of sessions, there’s no bearish engulfing structure yet. The ADL remains elevated, indicating that smart money hasn't exited the move.
If bulls defend the $0.23 level over the next few candles, it could lead to a retest of $0.246, and possibly a breakout toward the next minor resistance at $0.255.
IOTA Mid-Term Prediction: Will IOTA Hit $0.30?
From a technical standpoint, IOTA price is in the early stages of a trend reversal . A daily close above the 200-day SMA would be a strong confirmation. If that happens, the path toward $0.27–$0.30 opens up swiftly, as there is little overhead resistance until that level.
However, failure to hold above $0.228 support would raise concerns of a bull trap and shift momentum back in favor of bears, possibly dragging the price back toward $0.212 or lower.
Final Verdict
IOTA price is showing strong bullish structure on both macro and micro timeframes. With its multi-month resistance breached, aligned moving averages, and rising ADL, this rally is technically backed and not just hype-driven. The next 48 hours are key—a sustained close above $0.236 could ignite a larger breakout to $0.30. Caution is advised below $0.228.
IOTA (MIOTA) has suddenly re-entered the spotlight with an impressive +7% rally in the last 24 hours. As bullish sentiment spreads, traders and long-term investors are asking—is this breakout sustainable, or is IOTA at risk of another pullback? A close look at both the daily and hourly charts reveals several key indicators of where the token could be headed next.
IOTA Price Prediction: Multi-Month Resistance Breached
IOTA/USD Daily Chart- TradingView
The daily chart paints a clear technical picture : IOTA price has decisively broken out of a prolonged consolidation range between $0.20 and $0.23. After weeks of sideways trading, today’s breakout candle has surged above the 50-day and 100-day moving averages, both of which had previously acted as strong dynamic resistance.
What’s more critical is IOTA’s interaction with the 200-day simple moving average (SMA), currently near $0.2365. This level is not just psychological—it’s also where price faced rejection during February’s brief rally. Now that IOTA has pierced this threshold again, a confirmed daily close above $0.24 would flip the long-term trend to bullish.
The Heikin Ashi candle structure reflects rising momentum with strong consecutive green bodies and little-to-no lower wicks—suggesting trend strength and continued buyer pressure.
From a volume perspective, the Accumulation/Distribution Line (ADL) has been rising since mid-April, confirming steady capital inflows. Unlike previous fakeouts, this price surge appears to be fundamentally supported by real buying activity.
If the bullish momentum holds, the next visible resistance zone lies between $0.26 and $0.30, a historical region of congestion from the early 2023 structure.
IOTA Price Prediction: Near-Term Momentum Cooling, but Structure Remains Bullish
IOTA/USD 1 hr Chart- TradingView
Zooming in to the hourly chart, we see that IOTA price hit an intraday high of $0.2460 before facing immediate selling pressure. However, the pullback is healthy and expected, given the rapid climb.
Crucially, the 20, 50, and 100-hour moving averages are all sloped upward and are stacked in bullish order—a textbook setup of short-term trend strength. The price is still holding above the hourly 20-SMA, with the $0.232–$0.235 zone acting as the first strong support.
Even though Heikin Ashi candles show minor cooling in the last couple of sessions, there’s no bearish engulfing structure yet. The ADL remains elevated, indicating that smart money hasn't exited the move.
If bulls defend the $0.23 level over the next few candles, it could lead to a retest of $0.246, and possibly a breakout toward the next minor resistance at $0.255.
IOTA Mid-Term Prediction: Will IOTA Hit $0.30?
From a technical standpoint, IOTA price is in the early stages of a trend reversal . A daily close above the 200-day SMA would be a strong confirmation. If that happens, the path toward $0.27–$0.30 opens up swiftly, as there is little overhead resistance until that level.
However, failure to hold above $0.228 support would raise concerns of a bull trap and shift momentum back in favor of bears, possibly dragging the price back toward $0.212 or lower.
Final Verdict
IOTA price is showing strong bullish structure on both macro and micro timeframes. With its multi-month resistance breached, aligned moving averages, and rising ADL, this rally is technically backed and not just hype-driven. The next 48 hours are key—a sustained close above $0.236 could ignite a larger breakout to $0.30. Caution is advised below $0.228.
Disclaimer: The content of this article solely reflects the author's opinion and does not represent the platform in any capacity. This article is not intended to serve as a reference for making investment decisions.
You may also like
[Initial Listing] Bitget Will List DePHY (PHY). Come and grab a share of 6,600,000 PHY
New spot margin trading pair — ES/USDT!
Bitget Trading Club Championship (Phase 1) – Make spot trades daily to share 50,000 BGB
SLPUSDT now launched for futures trading and trading bots