Onyxcoin (XCN) Faces Resistance Amid Mixed Market Signals

Onyxcoin shows bullish signals with rising RSI and golden cross formation, but bearish BBTrend highlights uncertainty near resistance at $0.020.
Despite the growing bullish sentiment across the broader crypto market, Onyxcoin (XCN) gained only 5% in the past week. Although trading volume jumped 77.7% today, reaching $82.3 million, the altcoin continues to face resistance.
Momentum is rising, with the RSI climbing and a golden cross forming. But not all signals are bullish. The BBTrend remains negative, showing caution. Traders are watching to see if XCN can hold its breakout or if bears will take over.
XCN RSI Surges to 62 as Bullish Momentum Builds
Onyxcoin has shown a strong uptick in momentum, with its Relative Strength Index (RSI) climbing from 46.15 to 62.29 in just two days.
This rapid rise signals increased buying pressure and suggests that bullish sentiment is gaining strength.
RSI is a widely used momentum indicator that ranges from 0 to 100—readings above 70 typically indicate overbought conditions, while levels below 30 suggest the asset may be oversold.
 XCN RSI. Source:
TradingView.
XCN RSI. Source:
TradingView.
With XCN’s RSI now at 62.29, the token is nearing overbought territory but still has room to climb.
Importantly, Onyxcoin hasn’t crossed the 70 threshold since April 23, highlighting that while momentum is building, it hasn’t yet reached levels that often precede a pullback.
If the RSI continues rising, it could support further price gains, though traders will watch closely for signs of exhaustion.
Onyxcoin’s BBTrend Turns Negative Again After Brief Recovery
Onyxcoin BBTrend indicator is currently at -2.69, reflecting a renewed weakening in momentum after a brief recovery. Between April 29 and May 8, the BBTrend remained negative, signaling a bearish bias during that stretch.
On May 8, the indicator briefly flipped into positive territory, peaking at 2.66—suggesting a potential trend reversal—but that move was short-lived.
In the last few hours, the BBTrend has reversed again, falling sharply from -1.41 to -2.69, reinforcing a return to bearish pressure in the short term.
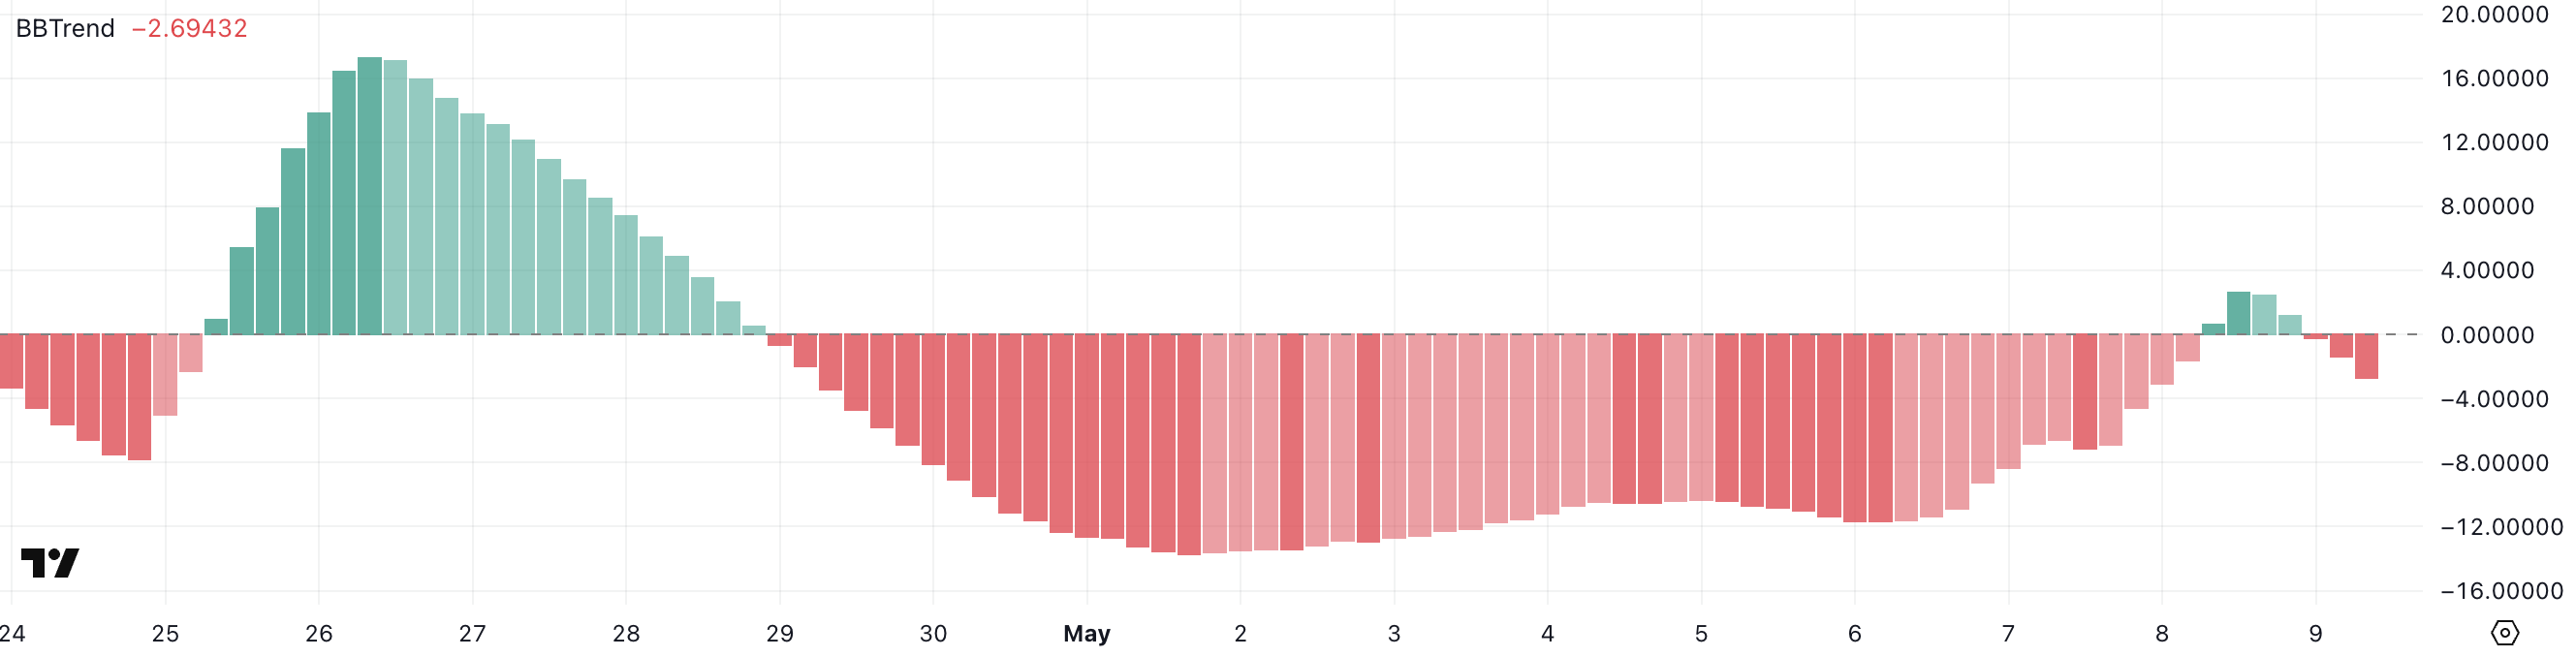 XCN BBTrend. Source:
TradingView.
XCN BBTrend. Source:
TradingView.
The BBTrend (Bollinger Band Trend) is a technical indicator that measures the strength and direction of a trend based on the distance between price and the Bollinger Bands.
Positive values typically indicate upward momentum and a potential continuation of bullish price action, while negative values point to downward momentum and increasing selling pressure.
With XCN’s BBTrend now deep in negative territory, it suggests that bearish sentiment is regaining control. Unless the indicator flips back to positive soon, the current setup implies limited upside and the possibility of further price weakness in the near term.
Golden Cross Forms on Onyxcoin: Can XCN Break Through Resistance?
Onyxcoin (XCN) has just formed a golden cross—a bullish technical pattern where the short-term moving average crosses above the long-term moving average.
This development often signals the beginning of a potential uptrend. If momentum continues, XCN could soon test the resistance at $0.020.
A breakout above that level may pave the way for further gains toward $0.024, and if the rally sustains, the price could climb as high as $0.0273. Onyxcoin has been one of the hottest altcoins of 2025, up 118% in the last 30 days.
 XCN Price Analysis. Source:
TradingView.
XCN Price Analysis. Source:
TradingView.
However, if the uptrend fails, key support levels could come into play.
The first area to watch is $0.0175—if that level is broken, XCN may decline to $0.0164.
Continued weakness could drag the price even lower to $0.0156.
Disclaimer: The content of this article solely reflects the author's opinion and does not represent the platform in any capacity. This article is not intended to serve as a reference for making investment decisions.
You may also like
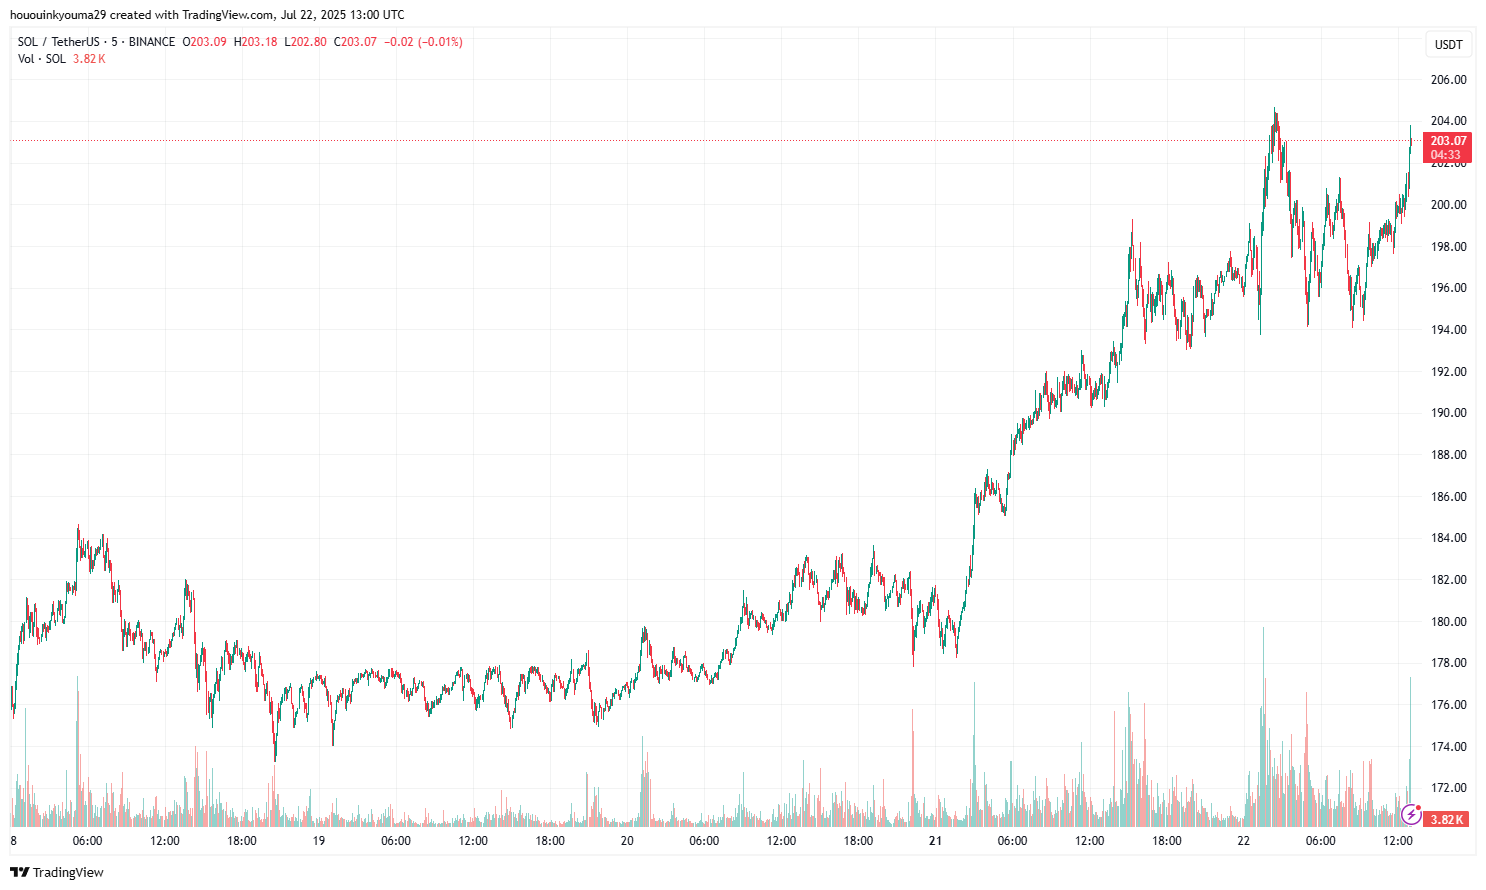
Solana Becomes The Talk Of Social Media As Price Hits $200
Taiko Blockchain Data: Unlocking Powerful Insights on Dune Analytics

ETH Bull Market through the Eyes of a 24-word Cryptography Expert: End-of-Year Target $4000, Is it the Starting Point or the Finishing Line?
Experts predict that the price of Ethereum (ETH) will reach an average of $4,308 by the end of 2025, rise to $10,882 by the end of 2030, and further climb to $22,374 by the end of 2035.