Shiba Inu (SHIB) was approaching a crucial moment as technical indicators, on-chain activity, and tokenomics signaled a potential price shift at press time. With over 410 trillion tokens already burned and network usage climbing through Shibarium, traders were closely watching for the next move.
The price hovered near a key support level, while the MACD indicator hints at a possible momentum reversal. So, the stage looks set for a breakout or extended consolidation.
Shiba Inu Token Burns Rise Sharply as Supply Drops Further
SHIB’s burn rate increased dramatically, with data from ShibBurn showing a 3,145% daily jump. It equated to 18.83 million SHIB tokens sent to an inaccessible address. Since its launch, over 410 trillion tokens have now been permanently removed from circulation.
This type of supply reduction, known as burning, helps maintain scarcity within the ecosystem. The process contrasts with token unlocks , which increase available supply and may put downward pressure on prices. Blockchain projects often use deflationary token supply to control inflation.
The Shibarium layer-2 network also plays a part in this process. Transaction fees on the network are partially converted to Shiba Inu and burned.
According to recent reports, Shibarium has now handled over 1.129 billion transactions. The network’s active wallet count has reached 206 million addresses. These figures show growing usage and engagement, which also supports the SHIB burning mechanism through fee activity.
Technical Indicators Show Resistance Ahead, with Early Signs of a Momentum Shift
SHIB price was trading at $0.00001437 with a 10.43% daily increase. It traded above a long-term ascending support trendline, in place since mid-2022. This trendline continues to offer structural support against deeper corrections.
Fibonacci retracement levels marked resistance zones. These included 23.6% at $0.00002479, 38.2% at $0.00003697, and 50% at $0.00004682. The 61.8% level, often watched by technical traders, stood at $0.00005667. Price movement toward any of these may slow or reverse if resistance holds.
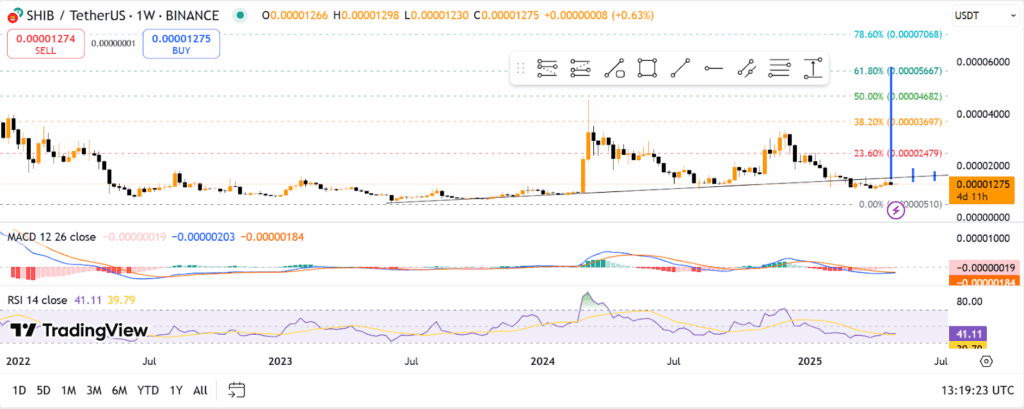 Source: TradingView
The MACD remained bearish, with the MACD line still under the signal line. However, the narrowing histogram bars may suggest a shift toward a bullish crossover if momentum builds. A confirmed crossover could signal stronger upward pressure.
The RSI stood at 41.11. It showed that the asset was neither oversold nor overbought. A rising RSI trend suggested slow buyer interest but remained below the 50 mark. It reflected weak overall momentum.
Shiba Inu Price Action and Whale Activity Indicate Accumulation Phase
Recent price candles showed small-bodied formations, typically associated with market indecision. This price action, combined with a bounce from the historical support level at $0.00000510, indicated possible accumulation .
Whale activity was also increasing. IntoTheBlock reported 48 large Shiba Inu transactions in the last 24 hours, close to the 7-day high of 49. The 7-day low was 29 on May 1. The rise in transaction size and frequency could suggest positioning ahead of a market move.
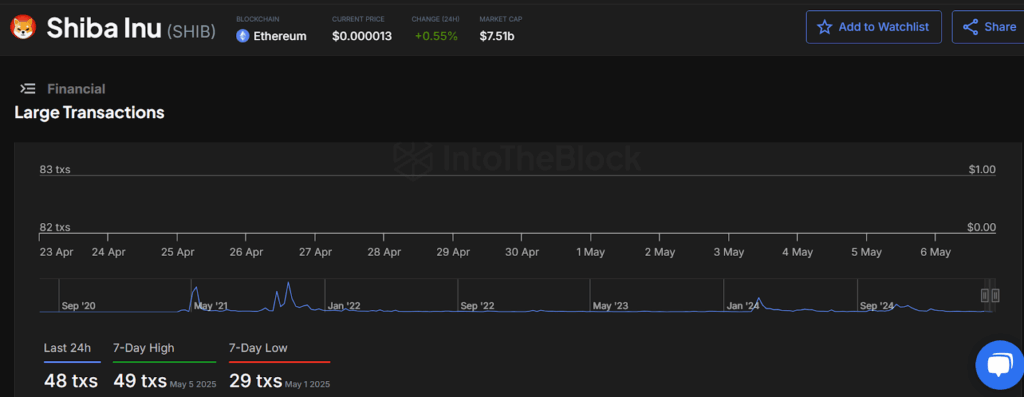 Source: IntoTheBlock
In past cycles, large transactions have occurred near periods of rising volatility. These transfers, often by whales or institutions, could signal either accumulation or portfolio adjustments. The consistent activity may point toward the ongoing strategic interest in SHIB.
Liquidation Trends Reflect Unclear Market Direction
According to data from CoinGlass, leveraged liquidation rates were not uniform throughout the day. A massive long position was closed out on April 7, with over $900,000 in the process, due to a decline in the value of Shiba Inu .
On April 23, there was a sharp increase in short liquidations in a short-lived price recovery. Since the beginning of April, short and long liquidations have also become less pronounced and more symmetrical.
This is an indication that traders are still applying leverage, but at markets that seem to have no clear trend. Long liquidations rose at the beginning of May, while short pressures remain lower.
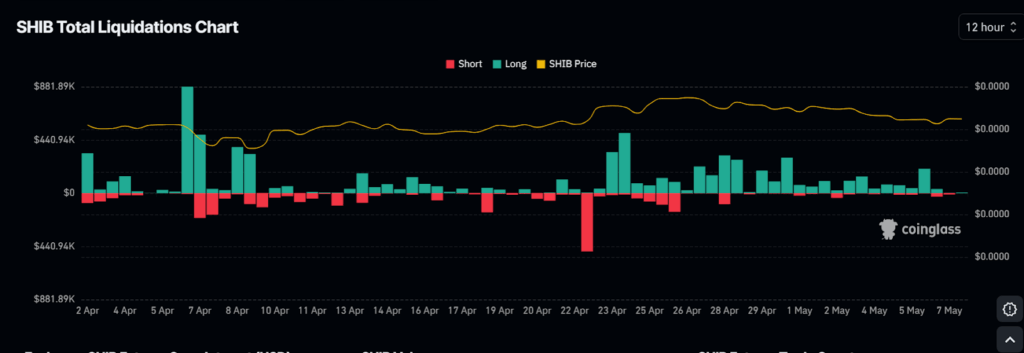 Source: CoinGlass
This may all indicate receding bullish sentiment amongst traders. The current RSI and Moving Average Convergence Divergence (MACD) pointed to limited action from traders. They might be waiting for the right signal to jump into the market.
Over the previous day, Shiba Inu remained stable around $0.00001275. So, a combination of lower liquidation volume and a meaningful flattening of the price range implied that a breakout that is now apparent with its over 10% price increase in a day.