

- Bitcoin has climbed past its key resistance area against the Nasdaq-100 for the first time in years.
- The breakout level was above 182 and the current move has reached 210.48 with clear upward movement.
- Traders now watch if Bitcoin can stay above the zone as it leads over strong tech market assets.
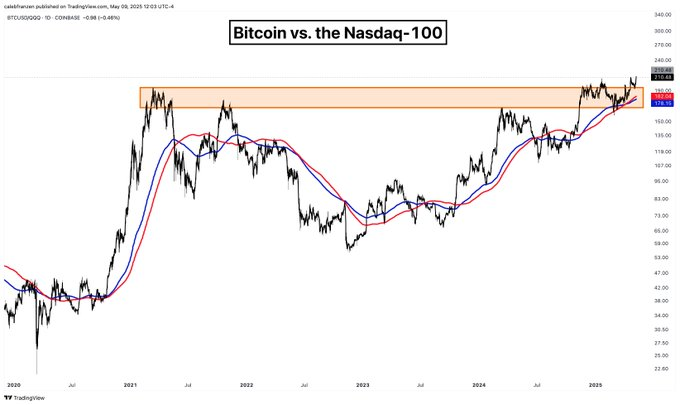
Nasdaq/Bitcoin has broken a major resistance against the Nasdaq-100, reaching 210.48 on the BTCUSD/QQQ ratio chart posted on May 9, 2025. The price strength relative to tech equities signals fresh momentum, as BTC outperforms one of the strongest U.S. stock indices. This breakout marks the highest level on the ratio since late 2021, suggesting a strong shift in market structure.
 Source:
X
Source:
X
BTC vs Nasdaq Breakout Signals Market Rotation
According to the TradingView chart shared by Caleb Franzen, Bitcoin has cleared an important resistance band between 178.51 and 182.04. This level, tested multiple times since early 2021, acted as a barrier during previous rallies. The current close above 210 marks a technical breakout from a three-year consolidation range.
The orange zone on the chart highlights the former resistance area. After repeated failures in 2021 and 2022, Bitcoin now trades well above it. The recent price action shows rising strength, which could indicate a market rotation from tech to crypto.
Moving averages on the chart support the trend. Both the red and blue lines, likely representing medium-term averages, are sloping upward and positioned below price. This setup typically confirms bullish continuation when combined with a breakout from long-standing horizontal resistance.
Relative Strength Reflects Broader Market Confidence
Bitcoin’s performance relative to the Nasdaq-100 is seen as a key signal of investor confidence in decentralized assets. As of May 2025, BTC is outperforming large-cap tech stocks, which traditionally hold strong positions in investor portfolios. A continued uptrend in this ratio suggests that capital may be rotating from equities into Bitcoin.
This movement aligns with other recent signs of crypto market leadership. Bitcoin has seen increased inflows and trading volume, while Nasdaq-100 constituents have experienced mixed performance. The crossover at the 182 level was seen as a trigger point for momentum traders.
Caleb Franzen’s post noted that the ratio chart “looks fantastic,” a sentiment echoed by many analysts observing the shift. With Bitcoin breaking through resistance levels that held for nearly three years, the technical narrative now leans toward sustained relative strength.
Can Bitcoin Maintain Leadership Over Tech Stocks?
The central question emerging now is whether Bitcoin can maintain dominance over the Nasdaq-100 in the coming months. With the ratio hitting 210.48, BTC is not only outperforming, but also signaling structural leadership. The current levels place Bitcoin in a position of technical and psychological strength.
For this outperformance to hold, continued price stability above the 182.04 breakout line is required. Should the ratio drop back below this area, the breakout could be invalidated. However, if price sustains or climbs higher, the long-term bullish structure remains intact.
Investors tracking rotation strategies are closely watching this ratio. Historically, breakouts from major resistance zones on relative charts have preceded larger shifts in capital flows. If the current trend continues, Bitcoin could further separate itself from traditional assets through Q2 and Q3 of 2025.