Bitcoin: Bullish Recovery Underway! Technical Analysis From May 13, 2025

Bitcoin accelerates and climbs back above $100,000: find our full analysis and the current technical outlook for BTC.

In brief
- Technical analysis: Bitcoin stabilizes above $102,800, supported by a 10% weekly increase and a 33% rise in volumes. The trend remains bullish, with improving momentum.
- Technical levels: Above $88,177, Bitcoin maintains a bullish bias after breaking $100,000. Resistances at $105,720 may slow momentum; supports from $100,790 remain key in case of a pullback.
- Market sentiment: Euphoric market sentiment (greed) with strong institutional inflows via BTC spot ETFs, confirming a strong risk appetite.
- Derivatives analysis: Derivatives confirm increasing buying pressure, driven by rising open interest, CVD imbalance, and short liquidations. The high positive funding rate highlights optimism but calls for monitoring overheating risks.
- Bitcoin price forecast: The bullish scenario remains favored above $91,700 with measured potential. In case of a breakdown, the pullback could be more pronounced. Confirmation will depend on upcoming U.S. macroeconomic signals.
BTC/USD Technical Analysis
Indicator Status Comment| Spot price | $102,895 | Sustained rise with a clear break above the $100,000 zone |
| Latest weekly change | 10% | Clear rebound after a consolidation phase, signaling renewed interest. |
| Latest weekly volume change | 42.73 (+33%%) | Activity is picking up, confirming market support for the price increase. |
| Long-term trend (SMA 200) | Bullish | Clearly upward trend, validating a positive underlying momentum. |
| Medium-term trend (SMA 50) | Bullish | Acceleration with a clearly bullish momentum. |
| Short-term trend (SMA 20) | Bullish | Marked upward phase with a very recent slight fatigue observable. |
| Momentum | Recovery | Positive and expanding momentum, indicating a bullish restart. |
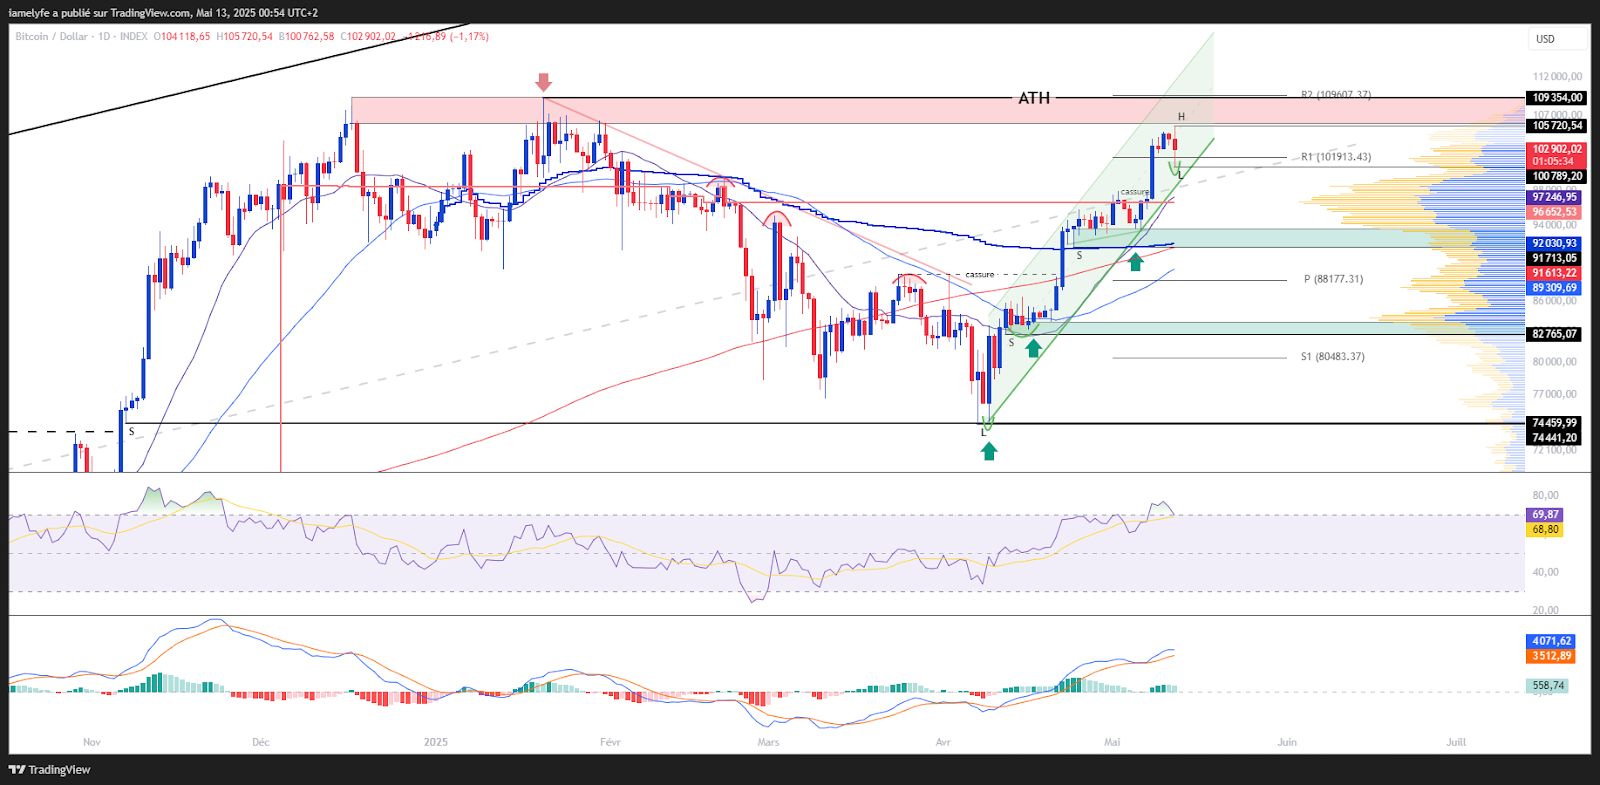
Bitcoin reaches $104,200, driven by sustained gains and a clear break above the major technical level of $100,000. The weekly increase of +10% confirms a clear rebound following a consolidation phase, reflecting a marked renewed interest. Weekly volumes rise by 33%, reaching $42.73 billion, a sign of growing market support for the current momentum. Trends are bullish across all timeframes—short, medium, and long term—with accelerating momentum and a slight recent short-term fatigue. Momentum is recovering, confirming an ongoing bullish move and validating the scenario of a solid bullish restart.
Bitcoin (BTC) Technical Levels
Indicator Status Comment| Resistances | $105,720 / $107,300 / $109,354 (ATH) | Critical zones, potential distribution thresholds. |
| Support | $100,790 / $91,700 / $82,765 | Major defense levels, probable accumulation zones. |
| Latest daily breakout | $98,000 – $100,000 | Resistance breached, bullish bias continues. |
| Monthly pivot point | $88,177 | Reference level for the month’s trend below the price. |
| High value area | $105,000 | High volume zone; upper boundary of a market balance, beyond which imbalance may emerge. |
| Low value area | $84,302 | High volume zone; lower boundary of a market balance, beyond which imbalance may emerge. |
Bitcoin trades above its monthly pivot point ($88,177), consolidating a bullish bias strengthened by the recent breakout of the $98,000 – $100,000 zone. Resistances at $105,720, $107,330, as well as BTC’s ATH at $109,354 represent critical thresholds likely to trigger profit-taking. Conversely, supports between $100,790 and $82,765 provide solid defensive zones favorable for accumulation. The price’s position near the high value area ($105,000) suggests an approach to equilibrium, beyond which a bullish imbalance could trigger or provoke a defensive market reaction.
Market Sentiment
| Market Sentiment (Fear & Greed Index) | Greed | Euphoric sentiment confirming the return of risk appetite. |
| BTC Spot ETF Flows (net flows) | Significant inflows | Institutional flows support the current trend. |
The market operates in a greed zone, reflecting euphoria and a clear renewed appetite for risk. BTC spot ETFs register significant inflows, indicating strong institutional support for the current bullish momentum.
 BTCUSD Daily Chart
The current technical analysis was carried out in collaboration with Elyfe , and 0xhugzer , investors and educators in the cryptocurrency market.
Derivatives Analysis (BTC/USDT)
| Indicator | Status | Comment |
| Open interest | Rising | Increasing speculative positioning, growing interest. |
| CVD | Buy side dominance | Predominantly buying flows, imbalance favoring buyers. |
| Liquidation | Strong, shorts side | Massive short liquidations, sign of seller capitulation. |
| Funding rate | High and positive | High funding rate signals bullish bias and higher cost for longs. |
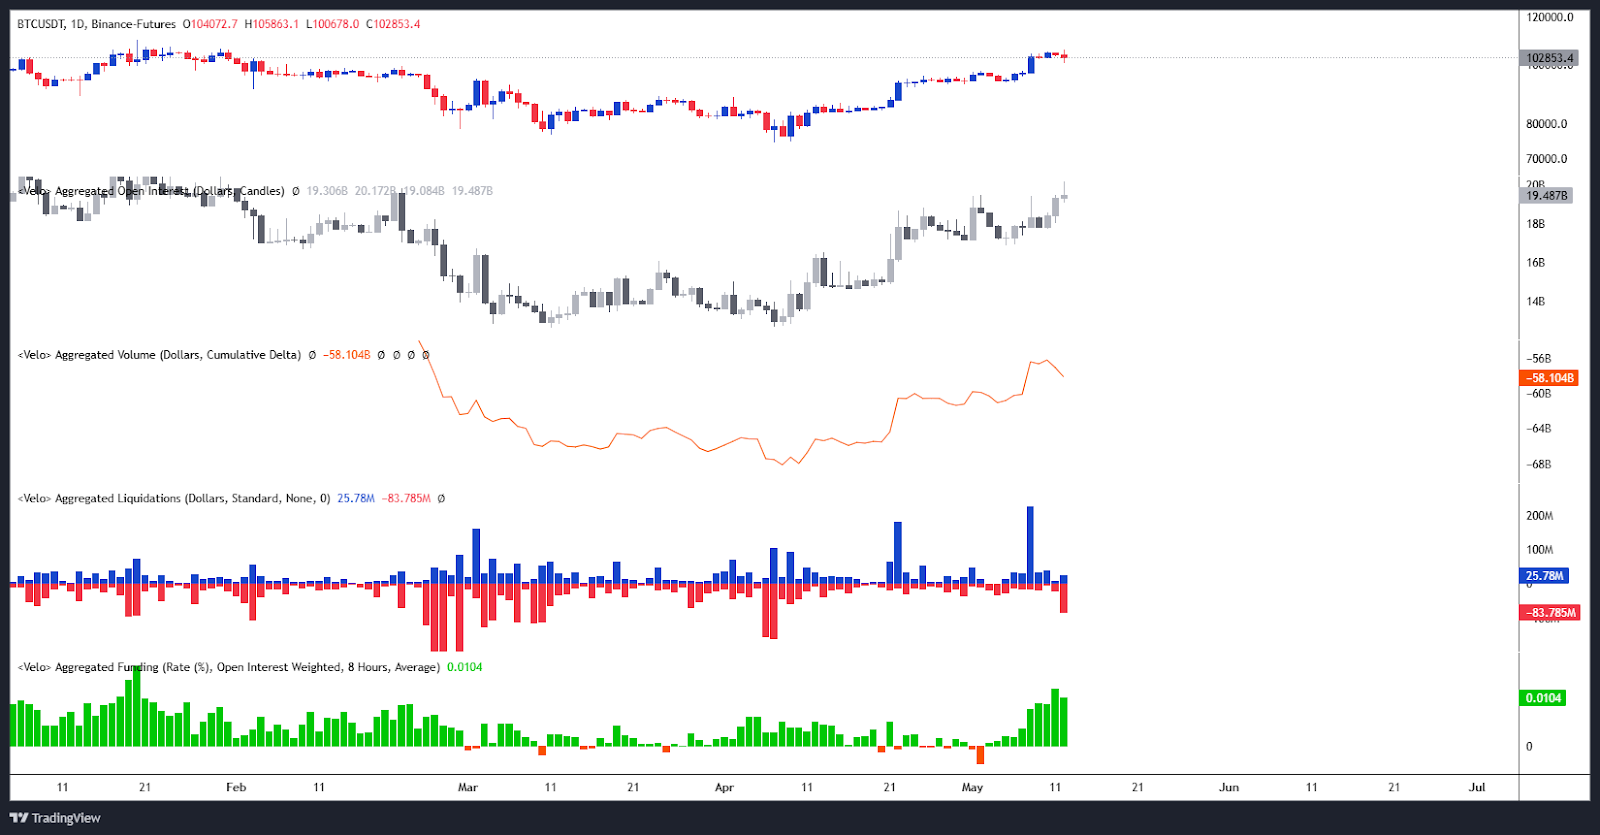
Current data show a renewed speculative interest with rising open interest, supported by dominant buying flows (CVD) and massive short liquidations, suggesting seller capitulation. The funding rate, at a high and positive level, reflects a marked bullish bias and increased cost for holding long positions. The overall signals indicate growing buying pressure and a bullish market sentiment. However, this scenario invites caution for possible overheating signs.
 Bitcoin Open Interest / Liquidations / CVD & Funding rate
| Indicator | Status | Comment |
| Sell-side liquidation zone | ≈ $107,200 – $108,200 / 109,300 & 109,900 – 110,500 | Critical zones in case of breakout, risk of movement amplification. |
| Buy-side liquidation zone | ≈ $93,400 – $90,900 / 87,700 – 85,400 & $84,000 – 80,000. | Critical thresholds on the downside, potential flush zones. |
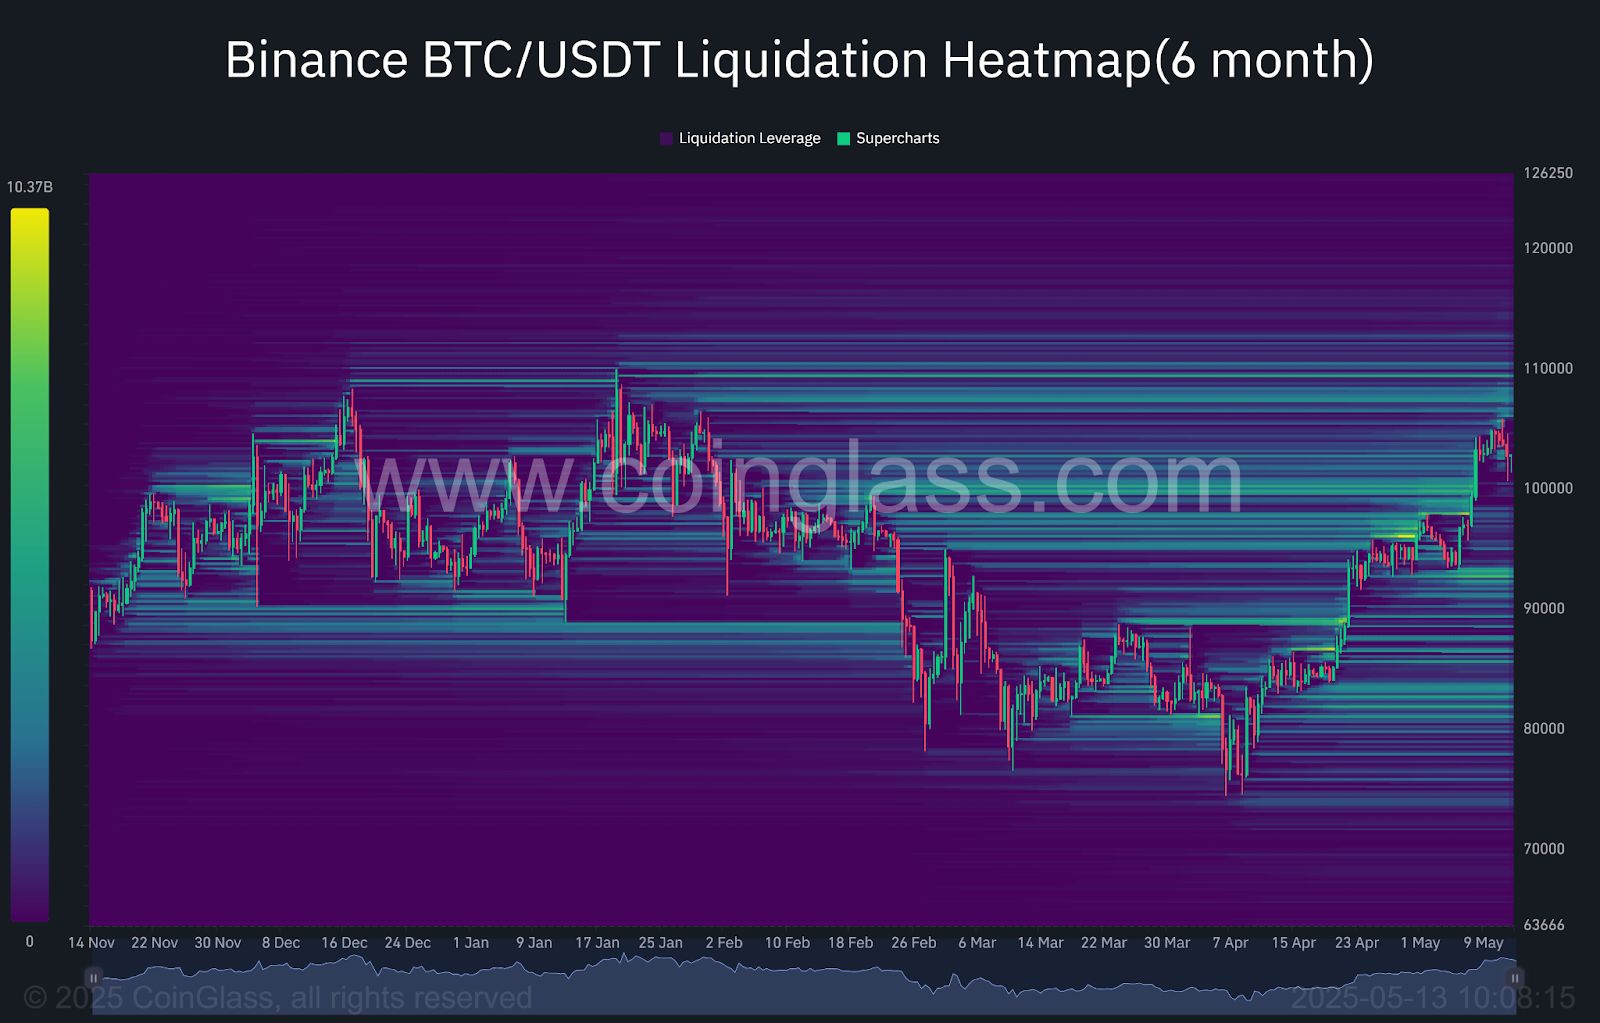
The market has several key liquidation zones to watch. Between $107,200 and $108,200, then around $109,300 as well as in the $109,900 to $110,500 zone, a bullish breakout could accelerate the movement. Conversely, levels between $93,400 and $90,900, $87,700 to $85,400, as well as the wide $84,000 to $80,000 zone, represent critical thresholds in case of a pullback, with a high risk of cascading liquidations. These areas represent leverage concentrations and should be viewed as potential volatility points.
 BTC Liquidation Heatmap
Bitcoin (BTC) Price Forecast
Bullish scenario:
- Conditions: Stay above $91,700.
- Targets: $105,720 / $107,300 / $109,354 (ATH).
- Potential: About +6.25% increase from the current level.
Bearish scenario:
- Conditions: Break of support at $91,700.
- Targets: $88,177 / $82,765 / $80,000 – $78,450.
- Potential: About -24% decrease from the current level.
Comment:
The bias remains bullish, but U.S. macroeconomic indicators such as CPI, retail sales, and Jerome Powell’s speech will be decisive to confirm this scenario.
Conclusion
Bitcoin maintains a bullish bias supported by positive momentum in prices, volumes, and overall sentiment. Buyer commitment remains strong, reinforcing the scenario of continued upward movement. However, in this context of marked confidence, vigilance is required against potential signs of fatigue or overheating. Particular attention should also be paid to macroeconomic and geopolitical factors that could strongly influence market behavior in the short term. In this context, it will be essential to closely monitor price reactions at strategic levels to confirm or adjust current forecasts.
Finally, let us remind you that these analyses are based solely on technical criteria, and that cryptocurrency prices can change rapidly depending on other more fundamental factors.
Did you find this study interesting? Check out our latest XRP analysis .
Disclaimer: The content of this article solely reflects the author's opinion and does not represent the platform in any capacity. This article is not intended to serve as a reference for making investment decisions.
You may also like
New spot margin trading pair — LA/USDT!
AINUSDT now launched for futures trading and trading bots
Bitget releases June 2025 Protection Fund Valuation Report
Join the BGB holding community and win 100% of the RCADE airdrop reward