After a sharp rally earlier this month, Dogecoin price today has entered a phase of short-term consolidation. Currently trading near $0.227, the memecoin is struggling to reclaim momentum after facing repeated rejection around the $0.24 to $0.25 zone. While the broader structure remains bullish, the market is signaling caution with mixed indicators and intraday weakness heading into May 14.
What’s Happening with Dogecoin’s Price?
The recent uptrend in Dogecoin price began around May 1, when DOGE broke above $0.20, triggering a strong breakout toward $0.253. However, after tagging that local high, the price sharply pulled back and is now testing a confluence of support zones around $0.217.
 DOGE price analysis (Source: TradingView)
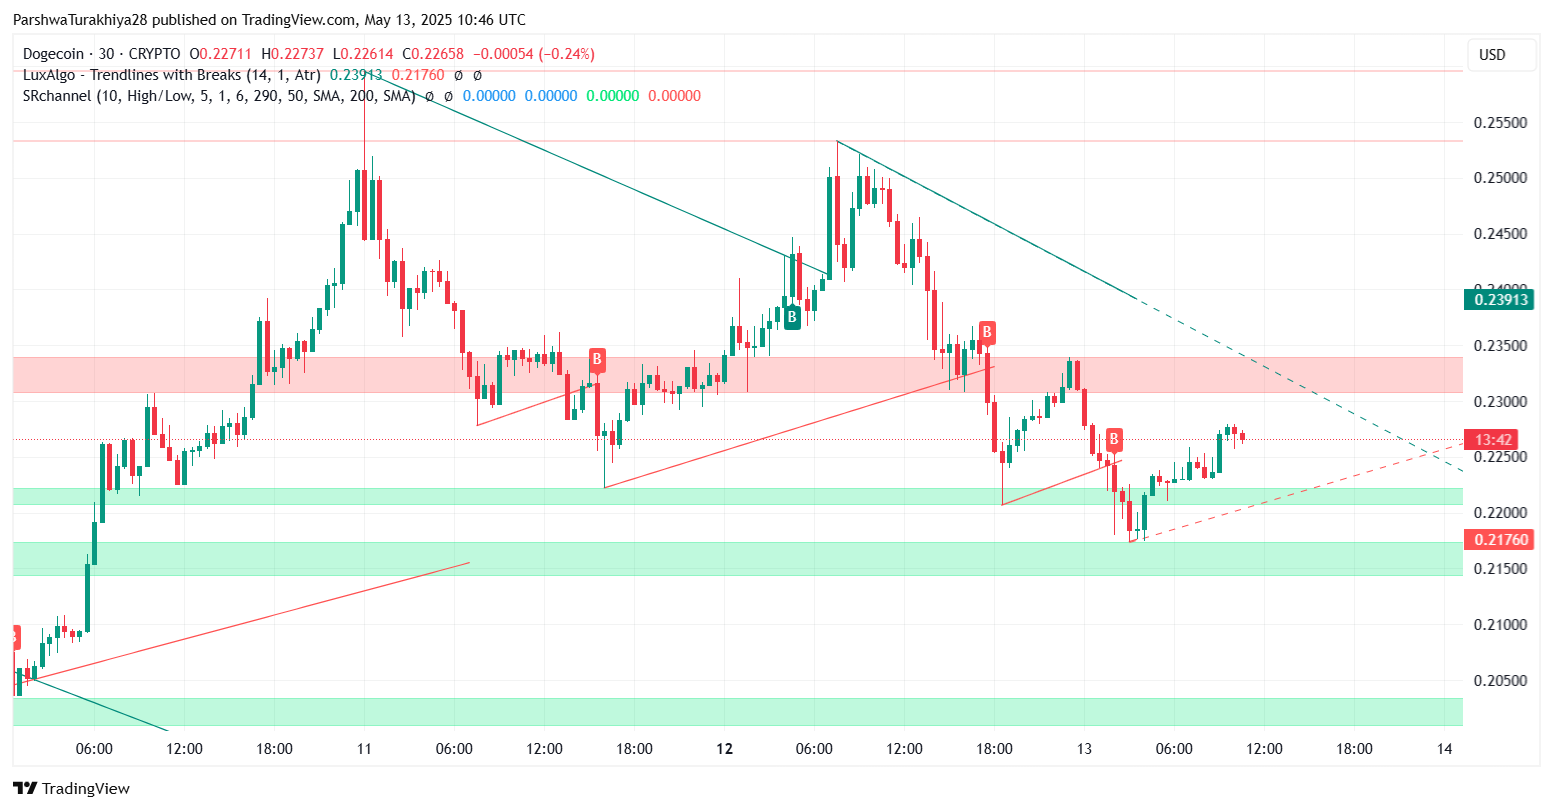
On the daily chart, Dogecoin price action is wedged between descending trendline resistance and horizontal support, creating a tight range. Price is consolidating between $0.217 and $0.231, forming a symmetrical triangle. This structure suggests that the next major move could come soon — but the direction will likely depend on volume expansion and broader market sentiment.
Dogecoin Price Short-Term Outlook: Momentum Indicators Flatten
 DOGE price analysis (Source: TradingView)
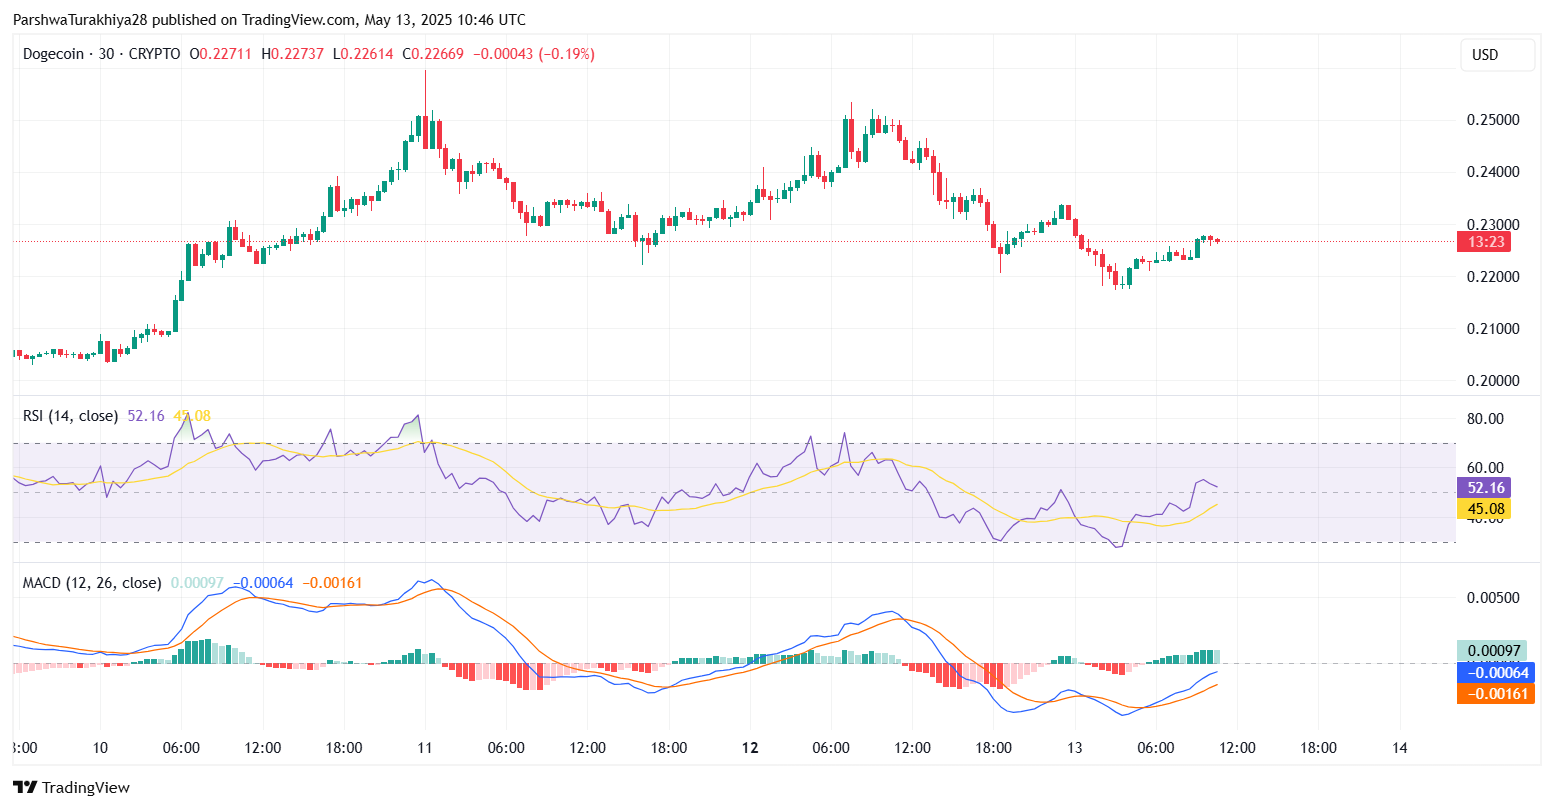
The 30-minute chart shows the RSI hovering around 52, indicating a neutral stance with no strong momentum on either side. MACD is barely above the zero line, showing signs of a weak bullish crossover. This supports the current picture of sideways Dogecoin price volatility, with neither bulls nor bears in clear control.
 DOGE price analysis (Source: TradingView)
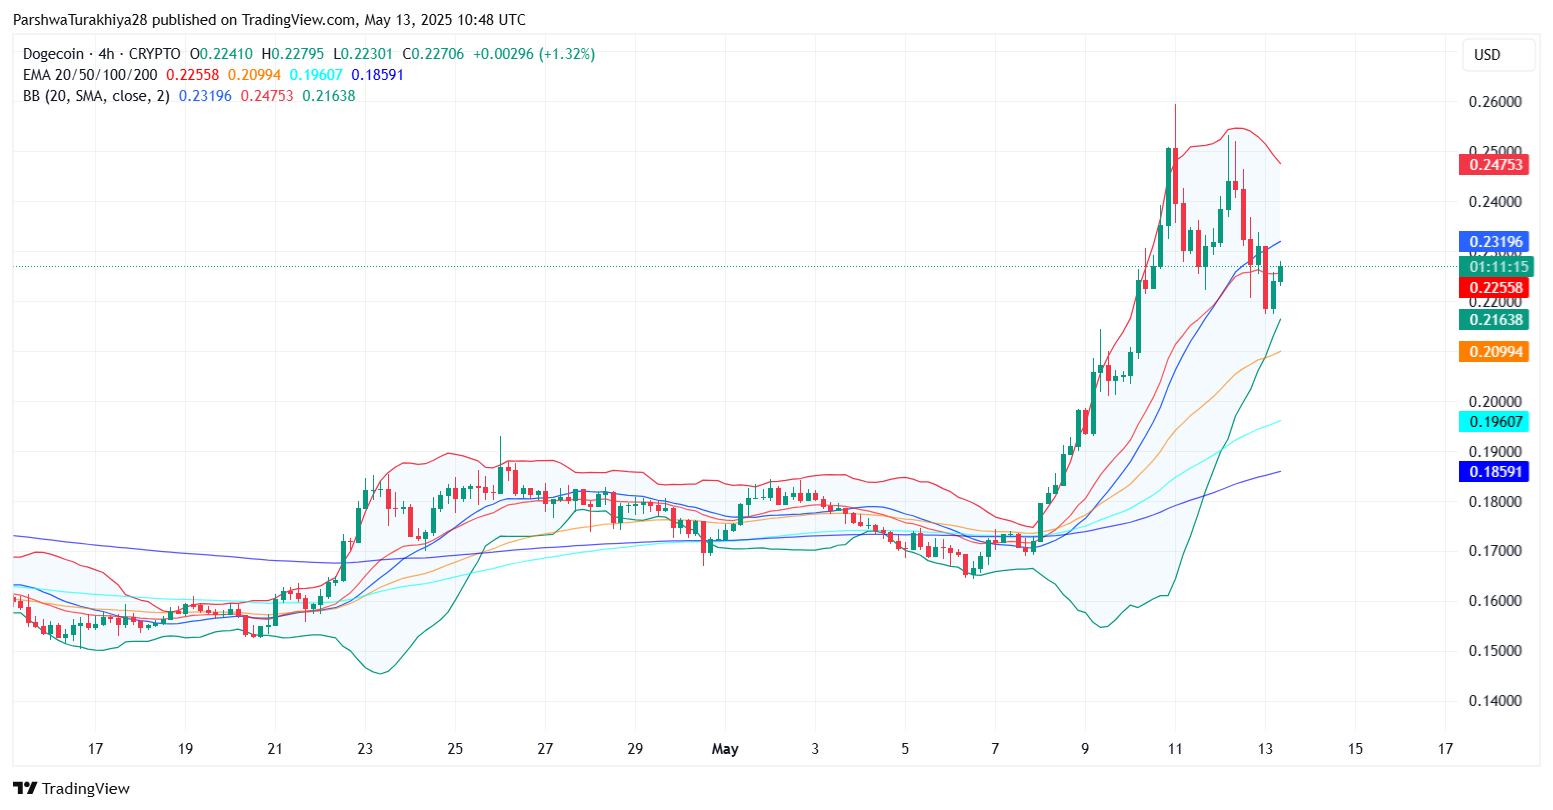
Bollinger Bands on the 4-hour chart are beginning to contract after expanding during the previous rally, indicating a cooling off period. Price is sitting near the midline of the bands at $0.231, which now acts as an intraday resistance level. On the downside, the lower band at $0.216 is the immediate area to watch for support.
Why Dogecoin Price Going Down Today?
The recent weakness in Dogecoin price comes after a fast run-up that pushed the token into overbought territory. Much of the selling pressure is technical in nature — traders booking profits as DOGE approached major resistance at $0.25.
Additionally, the price failed to break above the long-term descending trendline that stretches from the December highs, creating further hesitation. This resistance line, now aligned around $0.239, continues to cap upside moves and must be broken for any sustained bullish breakout.
 DOGE price analysis (Source: TradingView)
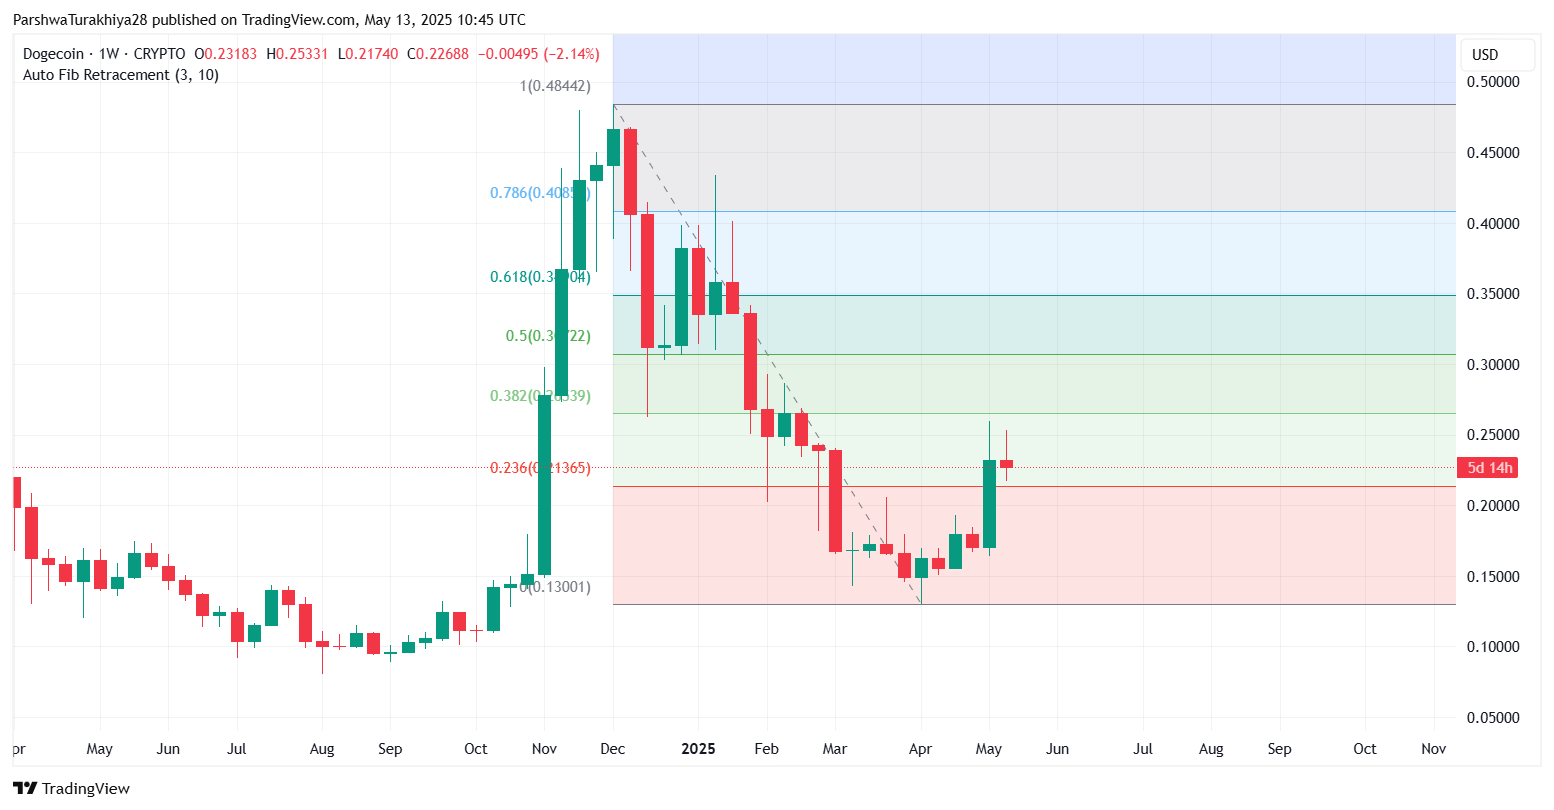
Weekly Fibonacci levels also explain the hesitation. DOGE is currently hovering just above the 0.236 retracement level at $0.214, which has flipped into short-term support. A close below this level could open the door toward $0.20 and even $0.18 in the coming days.
Dogecoin Price Update: Key Levels to Watch on May 14
The key resistance in the immediate term is $0.239 — a level marked by both trendline resistance and the upper boundary of the current triangle. A breakout above this with solid volume could push Dogecoin price back toward $0.253 and eventually $0.30.
On the downside, support rests around $0.217 and $0.209, which aligns with the 50 EMA on the 4H chart. A break below this zone would likely shift the structure from consolidation to correction, exposing DOGE to deeper support near $0.196 and $0.185.
Despite the short-term weakness, DOGE still holds above its 100-day EMA, indicating that medium-term bulls are not yet invalidated. The broader trend will remain intact as long as DOGE stays above $0.20 on the daily close.
Dogecoin Price Prediction for May 14
 DOGE price analysis (Source: TradingView)
The May 14 session could be pivotal. If DOGE can hold above $0.217 and reclaim $0.231 with conviction, a move toward $0.239 becomes likely. Traders should watch for a breakout from the triangle formation currently developing on the intraday chart.
However, if price fails to hold the $0.217–$0.220 support band, DOGE may revisit deeper levels. Volatility remains a factor, and tight Bollinger Bands suggest a breakout is near — traders should be prepared for sharp moves in either direction.
DOGE Technical Forecast Table: May 14
| Indicator/Zone | Level (USD) | Signal |
| Resistance 1 | 0.23196 | Bollinger midline, short-term cap |
| Resistance 2 | 0.23913 | Descending trendline barrier |
| Resistance 3 | 0.25300 | Previous swing high |
| Support 1 | 0.21760 | Triangle base and Fib 0.236 zone |
| Support 2 | 0.20994 | EMA50 and structural support |
| RSI (30-min) | 52.16 | Neutral momentum |
| MACD (30-min) | Slight bullish | Weak crossover, no confirmation |
| Bollinger Bands (4H) | Narrowing | Volatility compression |
| Weekly Fib 0.236 | 0.21400 | Key support level |
Disclaimer: The information presented in this article is for informational and educational purposes only. The article does not constitute financial advice or advice of any kind. Coin Edition is not responsible for any losses incurred as a result of the utilization of content, products, or services mentioned. Readers are advised to exercise caution before taking any action related to the company.