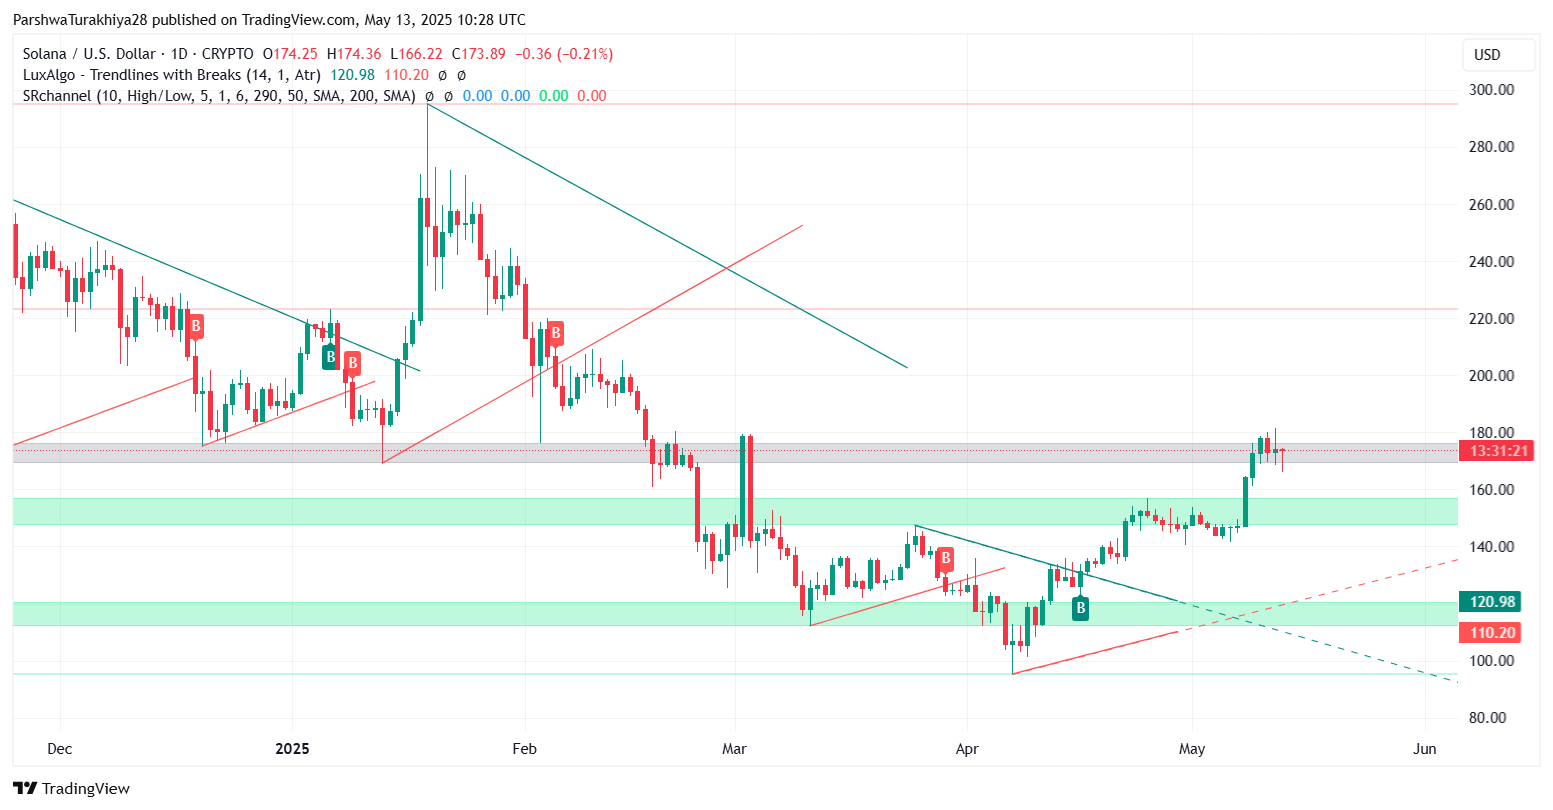
After a volatile start to the week, Solana price today is trading near $174, recovering steadily from its recent dip to $166. The sharp bounce has sparked optimism among bulls, but key resistance at $177 remains a hurdle. With indicators sending mixed signals and broader market sentiment still shaky, traders are closely watching whether Solana can sustain its recovery or fall back into the consolidation range.
What’s Happening With Solana’s Price?
 Solana price dynamics (Source: TradingView)
Solana price surged in early May, reaching as high as $181 before cooling off. The correction saw prices slide to $166 on May 12, aligning with a key support cluster just above the 50 EMA. This dip attracted buyers, leading to a rebound that is now testing the descending trendline once again.
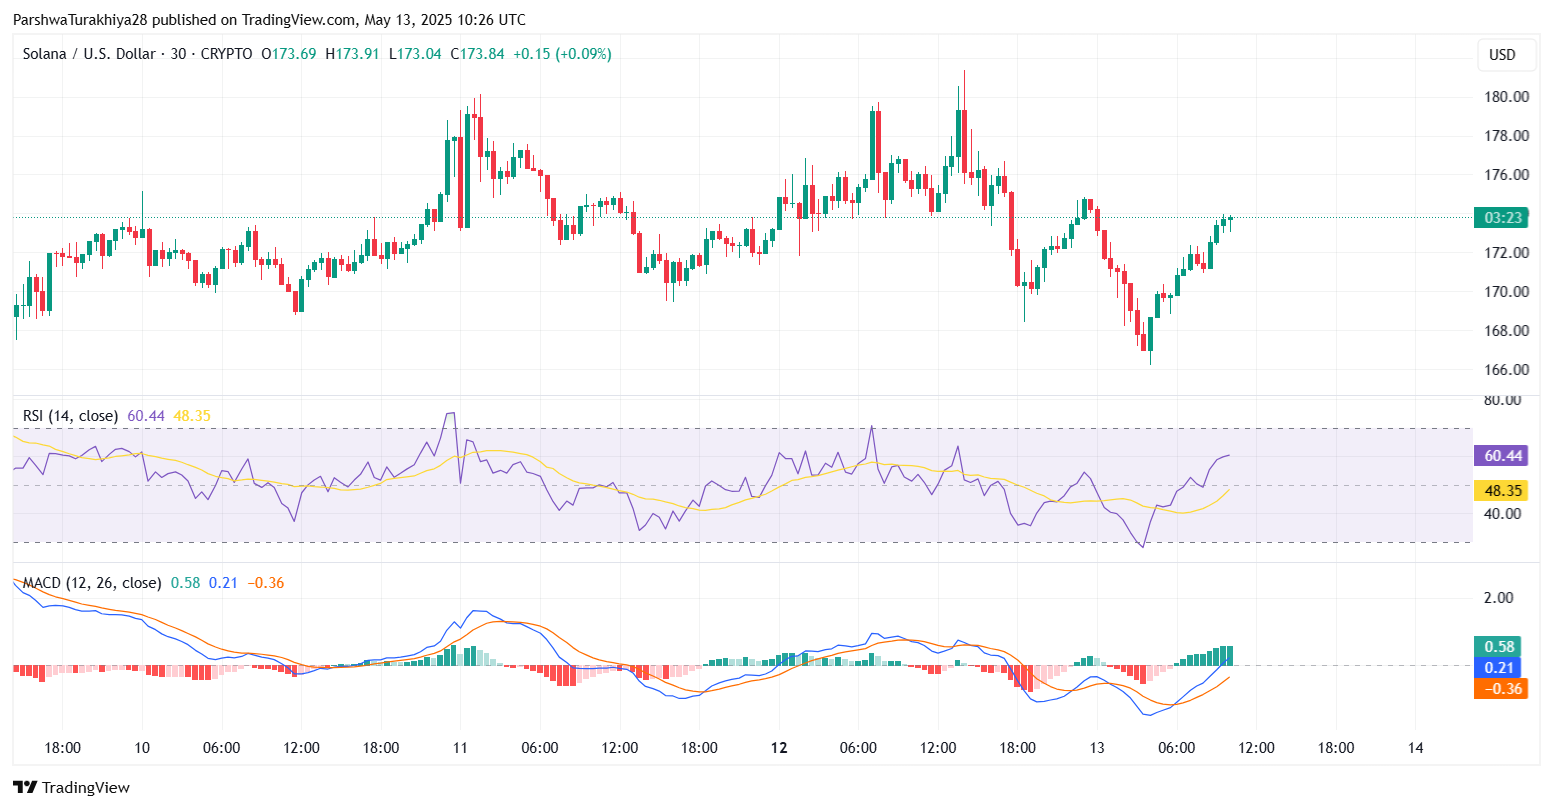
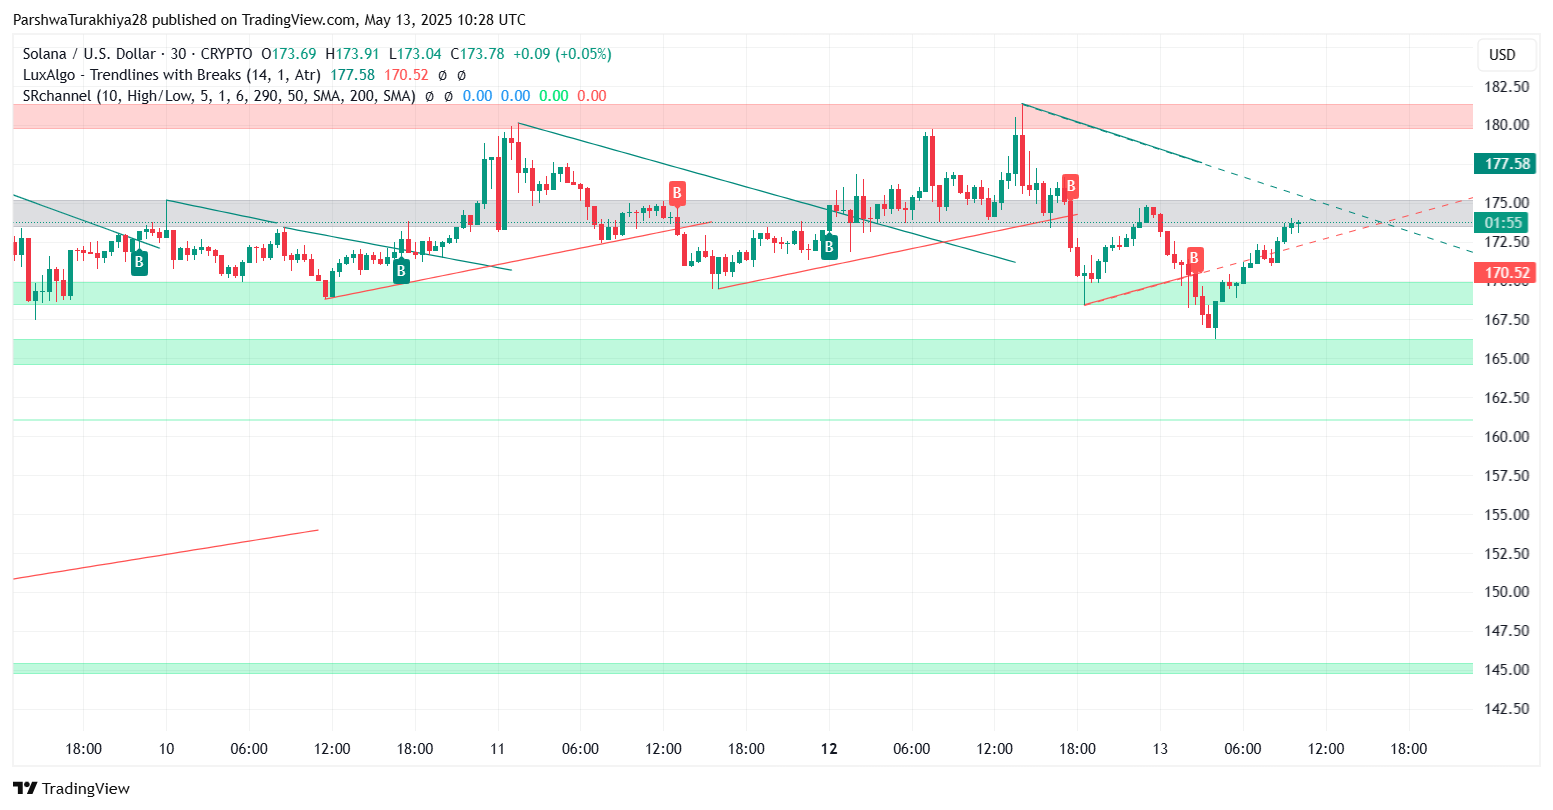
On the 4-hour chart, Solana price action shows a clear structure of higher lows forming above the $170.5 support. The recovery aligns with renewed buying activity near the lower Bollinger Band and a bullish reaction from the Ichimoku cloud base. However, overhead resistance remains strong at $177.58 — a level that has consistently rejected price action over the past three days.
Short-Term Technical Hint at Range Tightening
 Solana price dynamics (Source: TradingView)
Momentum indicators are beginning to recover. The 30-minute RSI has climbed to 60.4, suggesting moderate bullish momentum without entering overbought territory. The MACD histogram has flipped green with a fresh crossover, pointing to improving sentiment on lower timeframes.
Price is currently pressing against the upper boundary of a descending triangle visible on both 30-minute and 4-hour charts. While this breakout attempt looks promising, a clean close above $177 will be needed to confirm a short-term trend reversal.
 Solana price dynamics (Source: TradingView)
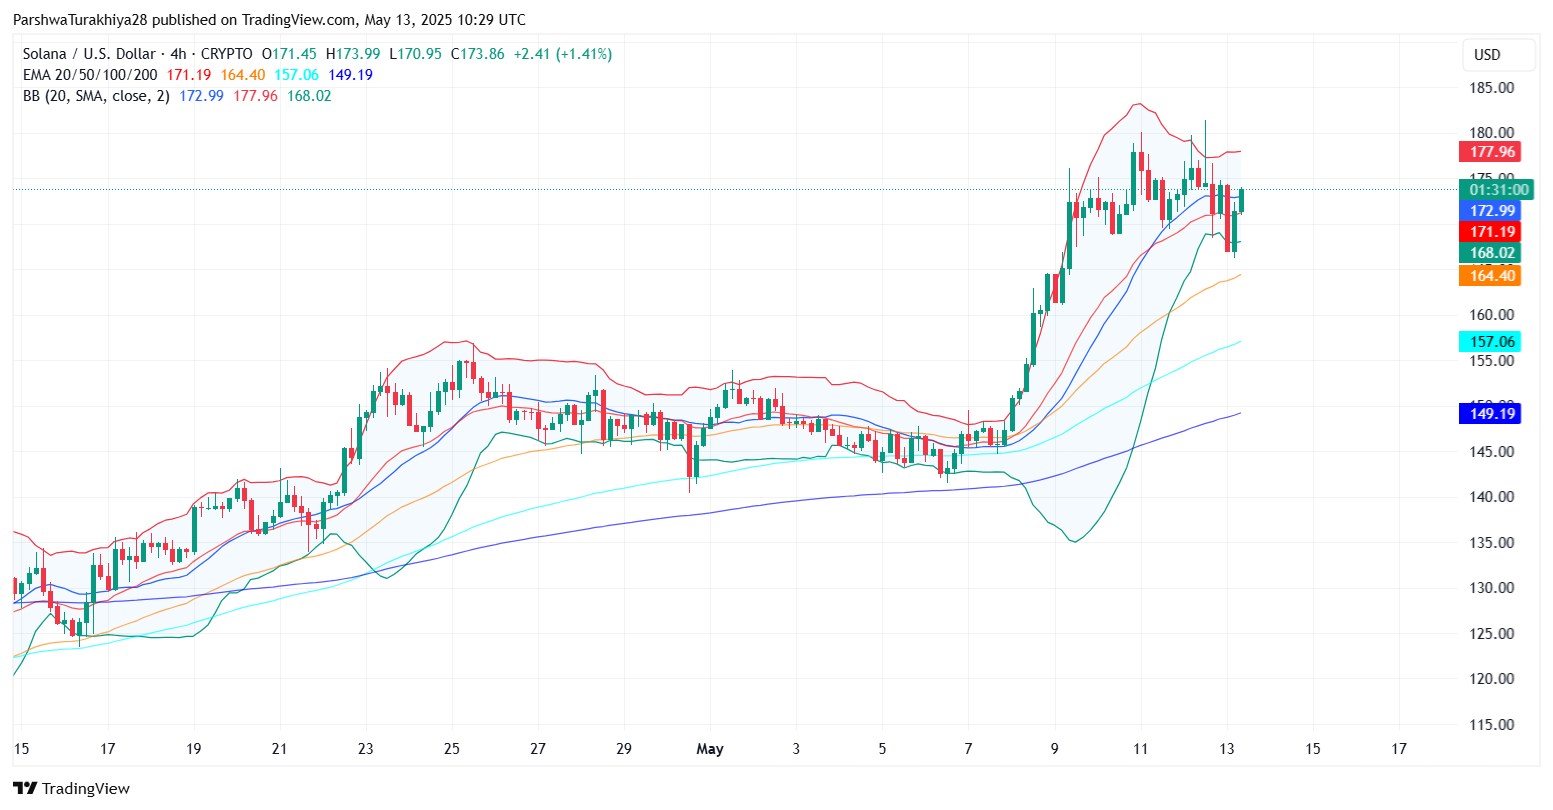
Bollinger Bands on the 4-hour timeframe are starting to expand after a period of compression. The mid-band is now acting as dynamic support near $172.99, while the upper band sits around $177.96 — reinforcing the significance of the resistance zone.
Why Solana Price Going up Today?
One of the key drivers behind Solana price spikes today is the bounce off the 20 and 50 EMAs, coupled with renewed buying from the lower support zone near $166. The intraday structure shows a rising wedge forming, suggesting accumulation.
 Solana price dynamics (Source: TradingView)
Another factor supporting the rise is the interaction with the Ichimoku cloud. SOL remains above the cloud on the 4-hour chart, with flat Tenkan-Sen and Kijun-Sen lines, signaling consolidation within an uptrend. Additionally, Stoch RSI is rebounding from the oversold zone (25.01), which historically precedes bullish breakouts.
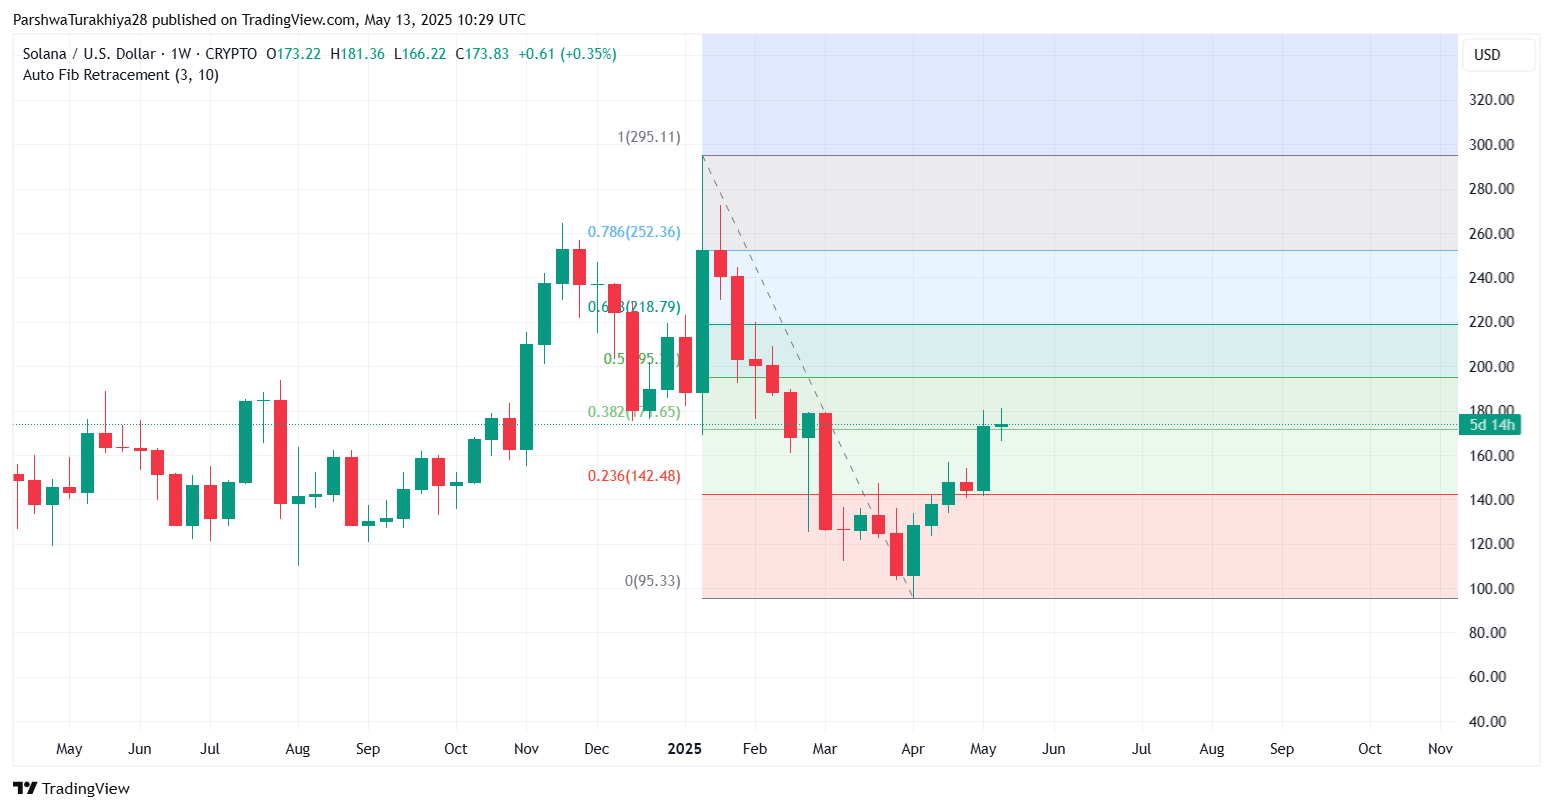
At the macro level, the weekly chart shows that Solana is now testing the 0.382 Fibonacci retracement level at $177.65. This level acted as support in early April and is now the pivot that could define the next leg higher or signal rejection.
Solana Price Update: Key Levels to Watch Ahead
 Solana price dynamics (Source: TradingView)
A successful breakout above $177.65 could trigger an extension toward $181, followed by $195 — the 0.5 Fibonacci zone. These levels align with previous areas of heavy trading and liquidity.
However, if Solana fails to break through the current resistance band, a drop back toward $170.5 and even $164.4 becomes likely. A decisive close below these levels would invalidate the bullish structure and expose the price to deeper losses, possibly toward $157 and $149.
The broader trend remains cautiously bullish as long as the Solana price stays above the dynamic 100 EMA near $157. With the 200 EMA trending below at $149.19, this level acts as the last line of defense for bulls in the medium term.
Solana Price Prediction for May 14
 Solana price dynamics (Source: TradingView)
The next 24 hours are likely to be defined by how price reacts around the $177 level. A volume-supported breakout could confirm the continuation of the uptrend, while another rejection may lead to choppy price action between $170 and $177.
Traders should monitor RSI and MACD closely for signs of fading momentum or divergence. Bollinger Band expansion suggests a larger move may be underway, and Ichimoku support at $171 remains a strong foothold for buyers.
SOL Technical Forecast Table: May 14
| Indicator/Zone | Level (USD) | Signal |
| Resistance 1 | 177.58 | Descending trendline cap |
| Resistance 2 | 181.00 | Previous high and breakout target |
| Support 1 | 170.52 | Near-term support cluster |
| Support 2 | 164.40 | EMA50 and demand zone |
| Weekly Fib 0.382 | 177.65 | Critical resistance pivot |
| RSI (30-min) | 60.4 | Mild bullish momentum |
| MACD (30-min) | Positive | Early bullish crossover |
| Stoch RSI (4H) | 25.01 | Recovery from oversold |
| Bollinger Band Width | Expanding | High Solana price volatility |
| Ichimoku Cloud (4H) | Above cloud | Trend intact |
Disclaimer: The information presented in this article is for informational and educational purposes only. The article does not constitute financial advice or advice of any kind. Coin Edition is not responsible for any losses incurred as a result of the utilization of content, products, or services mentioned. Readers are advised to exercise caution before taking any action related to the company.