
Solana Could Skyrocket From Here

Solana price is currently trading around $173 after shedding over 3% in the past 24 hours. This dip follows an impressive run that saw SOL break above key moving averages on the daily chart. However, the current Solana price action suggests profit-taking at the $180–$185 resistance zone. This correction aligns with broader market volatility, but the technical picture still offers hope for bulls.
Solana Price Prediction: Is SOL Price Losing Momentum on the Hourly Chart?
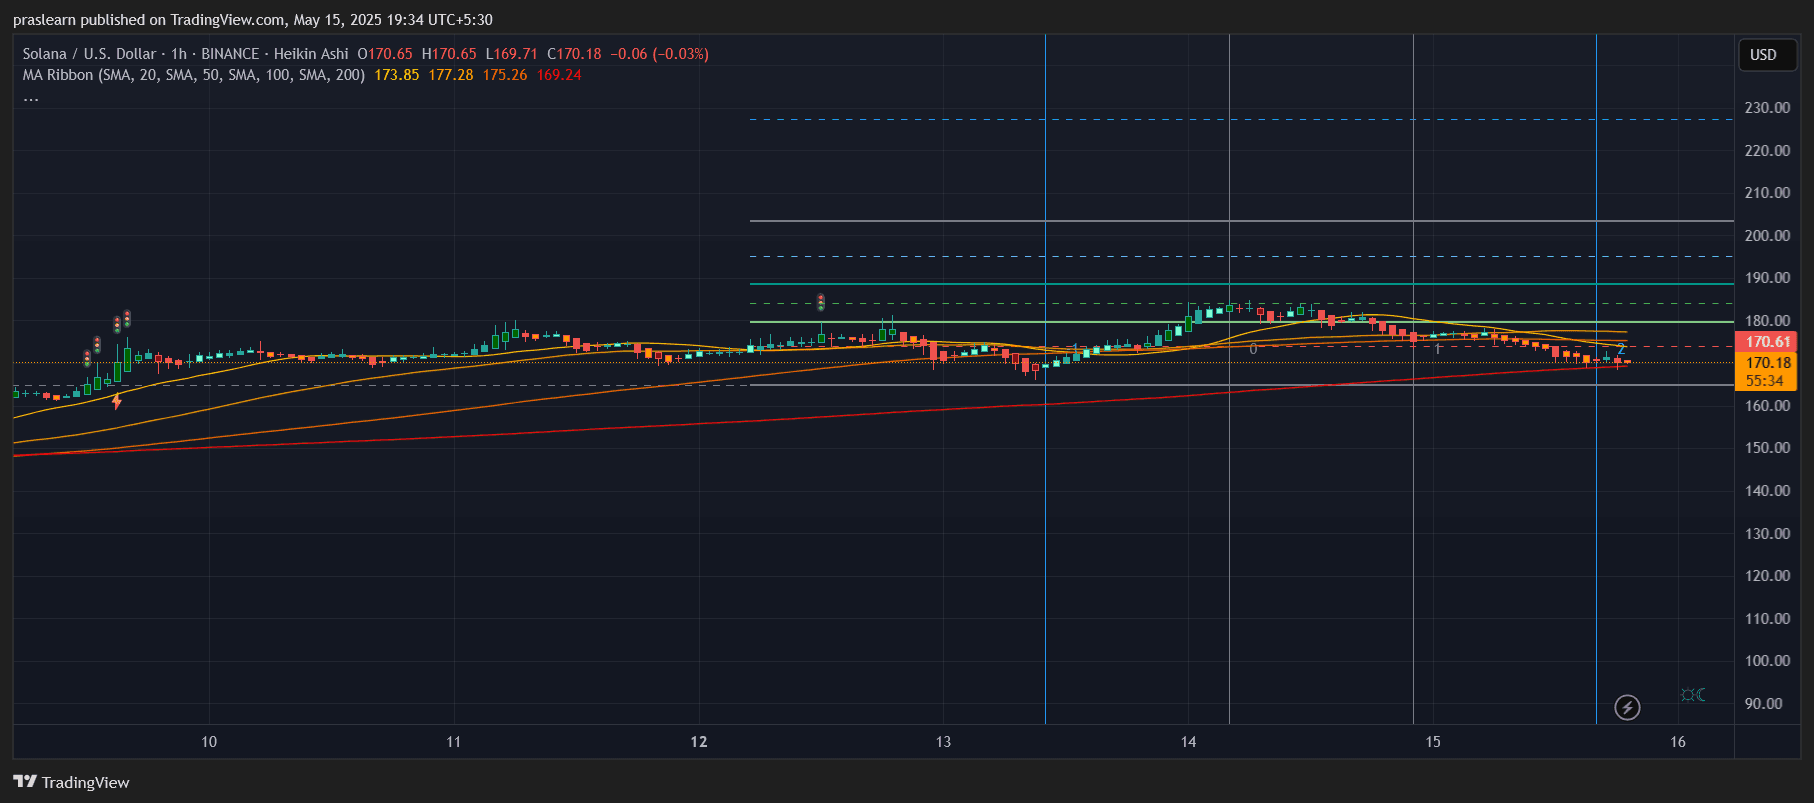 SOL/USD 1 Hr Chart- TradingView
On the hourly chart, SOL price recently broke below the 20 and 50 simple moving averages , now facing resistance near $175. The 100 SMA is trying to act as support around $170, while the 200 SMA has slightly flattened out, suggesting a tug-of-war between bulls and bears. Despite the current red candles, the downtrend is relatively contained, forming a staircase-style correction rather than a sharp dump.
The price is consolidating just above a trendline formed since May 10, and any breach below $168 may trigger a sharper drop toward $160. However, as long as SOL price holds above the 200-hour SMA , there's a good chance of a bounce.
What Does the Daily Chart Say About Solana’s Next Move?
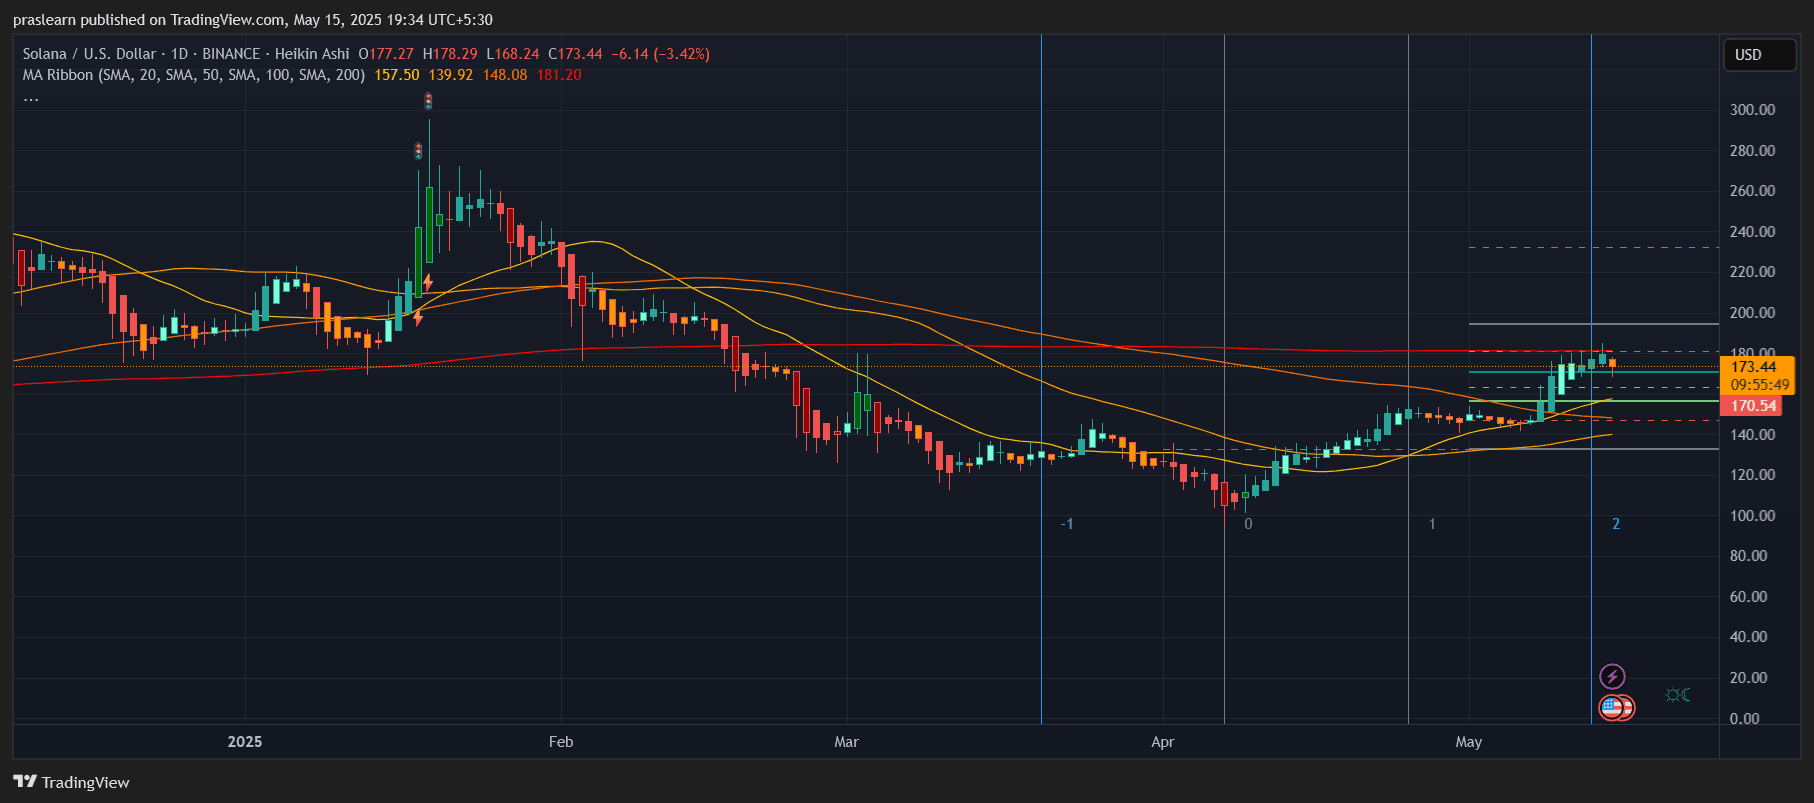 SOL/USD Daily Chart- TradingView
The daily chart is more optimistic. Solana price recently reclaimed the 50-day and 100-day moving averages , which are now stacked below the current price. The next major challenge is the 200-day SMA at around $181, which is currently acting as dynamic resistance. The rejection near this level has triggered the recent pullback, but the support structure below remains intact.
The Fibonacci retracement plotted from the previous peak near $210 to the recent low around $120 shows that SOL is holding above the 0.5 level, a sign that the correction is still healthy. A bounce from this zone could catapult the price toward the 0.618 level around $190 and possibly retest the psychological barrier at $200.
Can Solana Price Break Above $200 This Month?
For Solana to hit $200 in May, it needs to first reclaim $181 and close above it on the daily chart. This would flip the 200-day SMA into support and attract more momentum-driven buyers. Volume confirmation will be key here. If bulls can defend the $165–$170 support range and push above $185 with strong volume, the $200 breakout could happen quickly.
However, failure to hold above $165 would expose SOL to a deeper correction, potentially testing the $150 zone, where the 100-day moving average lies. That would delay any hopes of a breakout rally this month.
What’s the Solana Price Prediction for This Week?
Short-term, Solana price is likely to remain range-bound between $165 and $181. A bullish breakout above $181 could set the stage for a retest of $190 and beyond. Conversely, a breakdown below $165 would signal growing weakness and shift the target to $150. The RSI on both hourly and daily charts appears neutral, hinting at a potential buildup before a bigger move.
Given the overall market sentiment and Solana’s strong recovery from April lows, the path of least resistance still leans upward. But confirmation is needed in the form of reclaiming and holding $181 on a daily close.
Conclusion
Solana's recent correction is not a trend reversal but a natural cool-off after a strong rally. If key supports hold, SOL still has a valid shot at testing $190–$200 in the coming days. Caution is advised below $165, but the bullish structure remains intact for now.
Solana price is currently trading around $173 after shedding over 3% in the past 24 hours. This dip follows an impressive run that saw SOL break above key moving averages on the daily chart. However, the current Solana price action suggests profit-taking at the $180–$185 resistance zone. This correction aligns with broader market volatility, but the technical picture still offers hope for bulls.
Solana Price Prediction: Is SOL Price Losing Momentum on the Hourly Chart?
SOL/USD 1 Hr Chart- TradingView
On the hourly chart, SOL price recently broke below the 20 and 50 simple moving averages , now facing resistance near $175. The 100 SMA is trying to act as support around $170, while the 200 SMA has slightly flattened out, suggesting a tug-of-war between bulls and bears. Despite the current red candles, the downtrend is relatively contained, forming a staircase-style correction rather than a sharp dump.
The price is consolidating just above a trendline formed since May 10, and any breach below $168 may trigger a sharper drop toward $160. However, as long as SOL price holds above the 200-hour SMA , there's a good chance of a bounce.
What Does the Daily Chart Say About Solana’s Next Move?
SOL/USD Daily Chart- TradingView
The daily chart is more optimistic. Solana price recently reclaimed the 50-day and 100-day moving averages , which are now stacked below the current price. The next major challenge is the 200-day SMA at around $181, which is currently acting as dynamic resistance. The rejection near this level has triggered the recent pullback, but the support structure below remains intact.
The Fibonacci retracement plotted from the previous peak near $210 to the recent low around $120 shows that SOL is holding above the 0.5 level, a sign that the correction is still healthy. A bounce from this zone could catapult the price toward the 0.618 level around $190 and possibly retest the psychological barrier at $200.
Can Solana Price Break Above $200 This Month?
For Solana to hit $200 in May, it needs to first reclaim $181 and close above it on the daily chart. This would flip the 200-day SMA into support and attract more momentum-driven buyers. Volume confirmation will be key here. If bulls can defend the $165–$170 support range and push above $185 with strong volume, the $200 breakout could happen quickly.
However, failure to hold above $165 would expose SOL to a deeper correction, potentially testing the $150 zone, where the 100-day moving average lies. That would delay any hopes of a breakout rally this month.
What’s the Solana Price Prediction for This Week?
Short-term, Solana price is likely to remain range-bound between $165 and $181. A bullish breakout above $181 could set the stage for a retest of $190 and beyond. Conversely, a breakdown below $165 would signal growing weakness and shift the target to $150. The RSI on both hourly and daily charts appears neutral, hinting at a potential buildup before a bigger move.
Given the overall market sentiment and Solana’s strong recovery from April lows, the path of least resistance still leans upward. But confirmation is needed in the form of reclaiming and holding $181 on a daily close.
Conclusion
Solana's recent correction is not a trend reversal but a natural cool-off after a strong rally. If key supports hold, SOL still has a valid shot at testing $190–$200 in the coming days. Caution is advised below $165, but the bullish structure remains intact for now.
Disclaimer: The content of this article solely reflects the author's opinion and does not represent the platform in any capacity. This article is not intended to serve as a reference for making investment decisions.
You may also like
Bitget Launches PLUME On-chain Earn With 4.5% APR
Bitget Trading Club Championship (Phase 2) – Grab a share of 50,000 BGB, up to 500 BGB per user!
Bitget Trading Club Championship (Phase 2) – Grab a share of 50,000 BGB, up to 500 BGB per user!
Subscribe to UNITE Savings and enjoy up to 15% APR