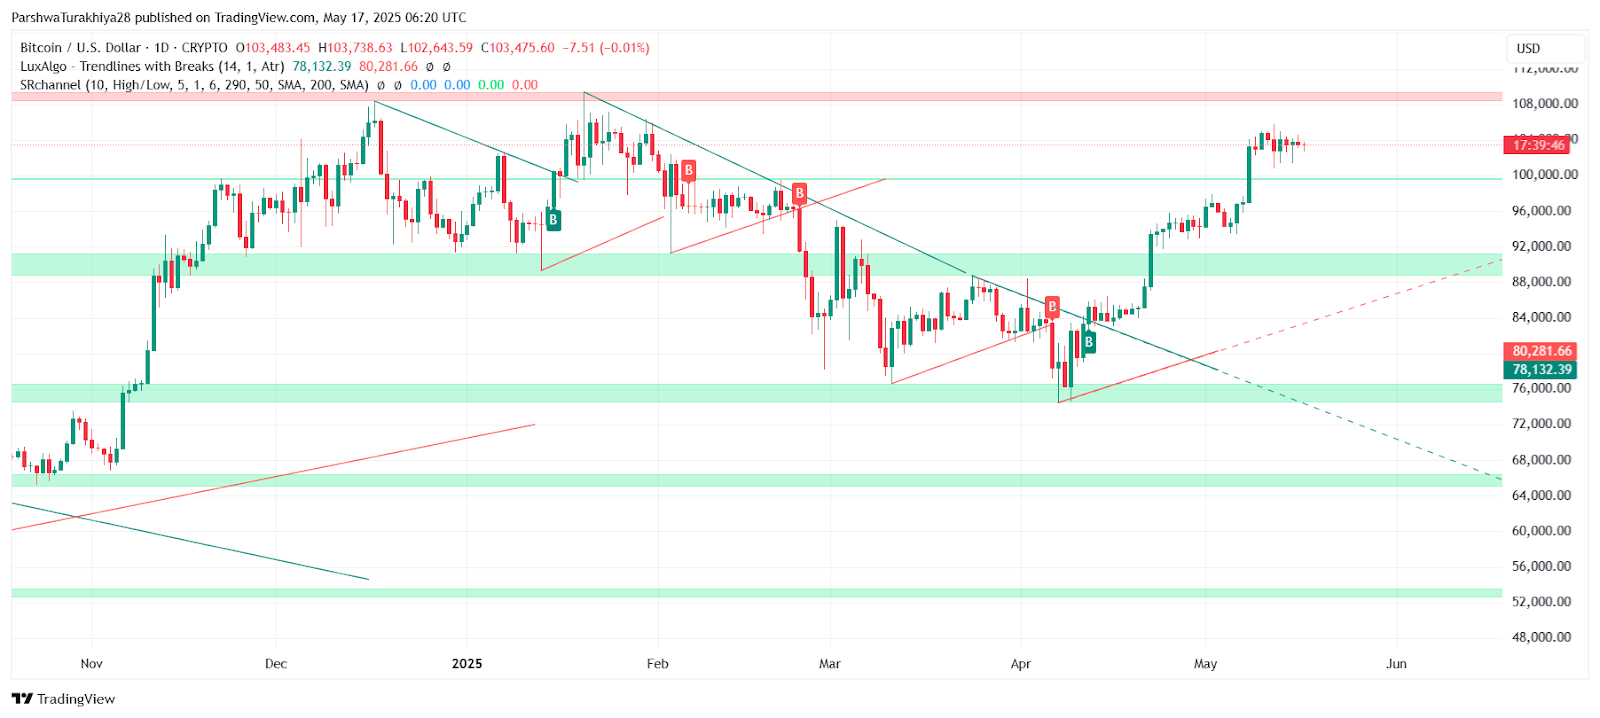
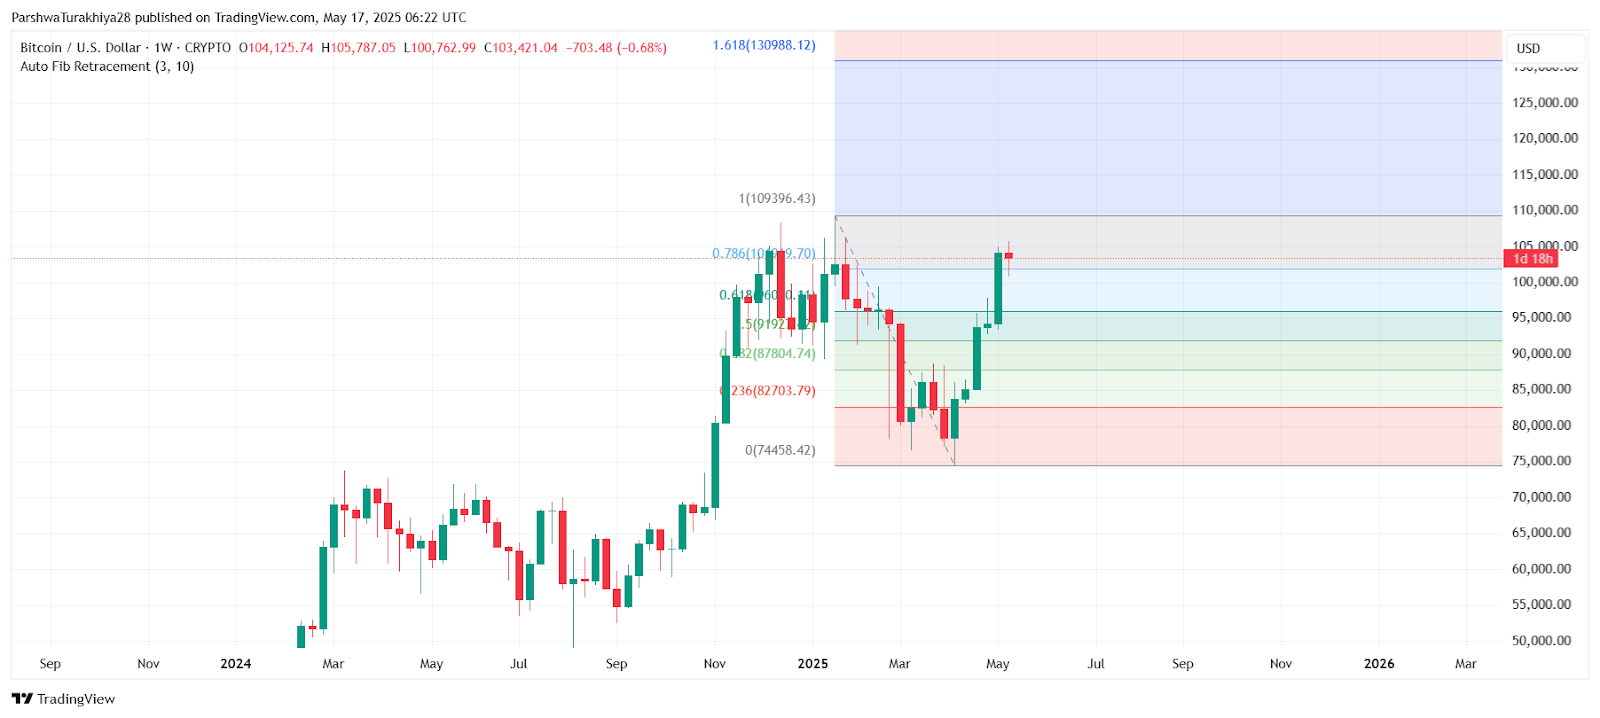
Bitcoin price today is hovering around $103,400 after failing to sustain momentum above $105,000 earlier this week. Despite a strong recovery from $100,762, recent candles show indecision with tightening Bollinger Bands and flattening RSI. The current rangebound movement comes after a multi-week rally that saw Bitcoin price spikes toward $105,787, followed by sustained rejection near major Fibonacci resistance.
What’s Happening With Bitcoin’s Price?
 BTCUSD price dynamics (Source: TradingView)
The Bitcoin price action on the 1-day chart remains bullish from a macro lens, with the asset firmly above the March–April downtrend breakout. The latest weekly candle formed a long upper wick just below the 0.786 Fibonacci level at $104,929, indicating heavy supply pressure. This area near $105,000 has acted as a historical rejection zone and now caps further upside unless cleared decisively.
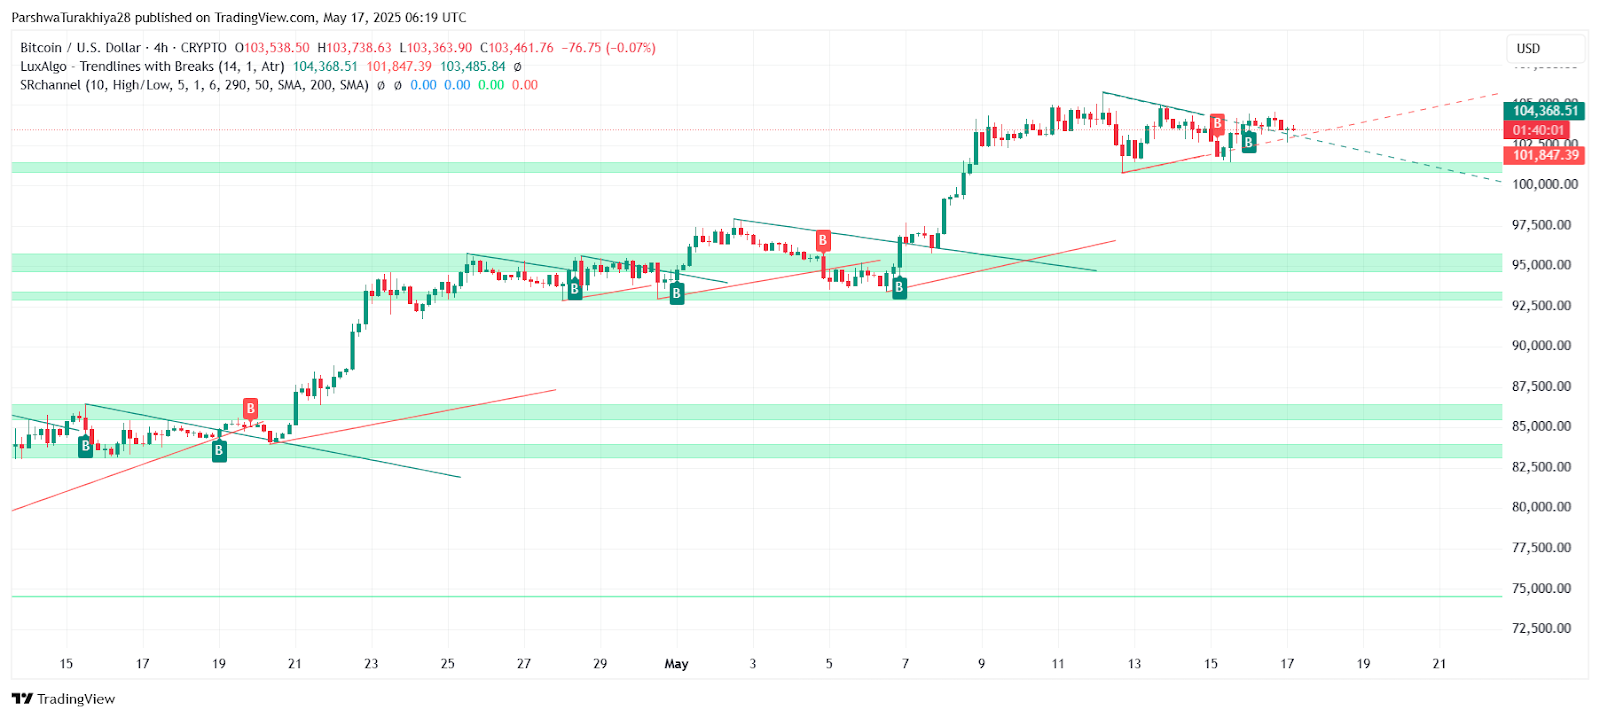
On the 4-hour chart, price remains inside a narrow consolidation triangle, with lower highs and slightly higher lows. This structure has developed just above the 50 EMA at $102,533, a critical dynamic support that must hold for bulls to maintain control. Any close below this could increase Bitcoin price volatility and trigger retests toward the $101,500 and $100,800 zones.
Indicators Signal Potential for Breakout or Breakdown
 BTCUSD price dynamics (Source: TradingView)
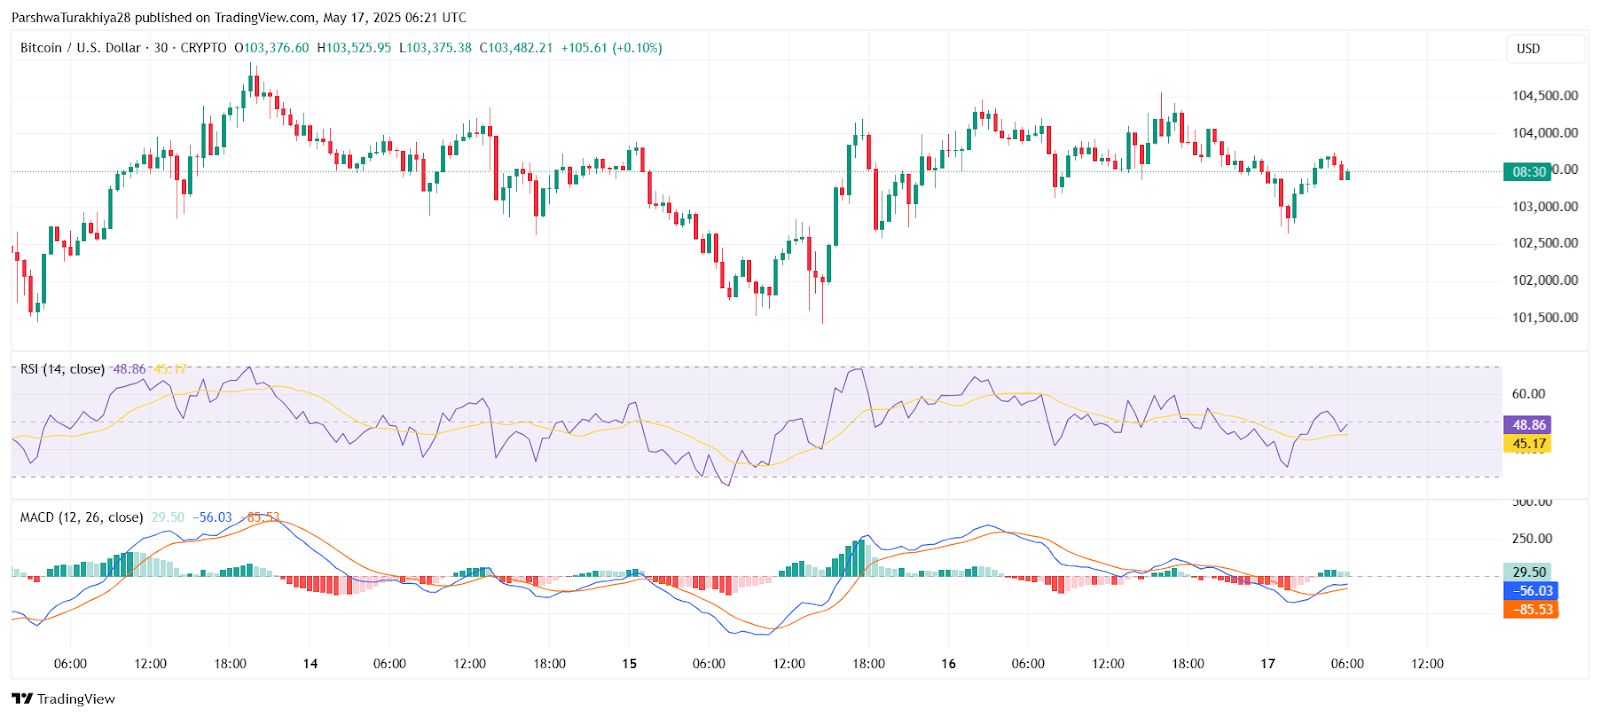
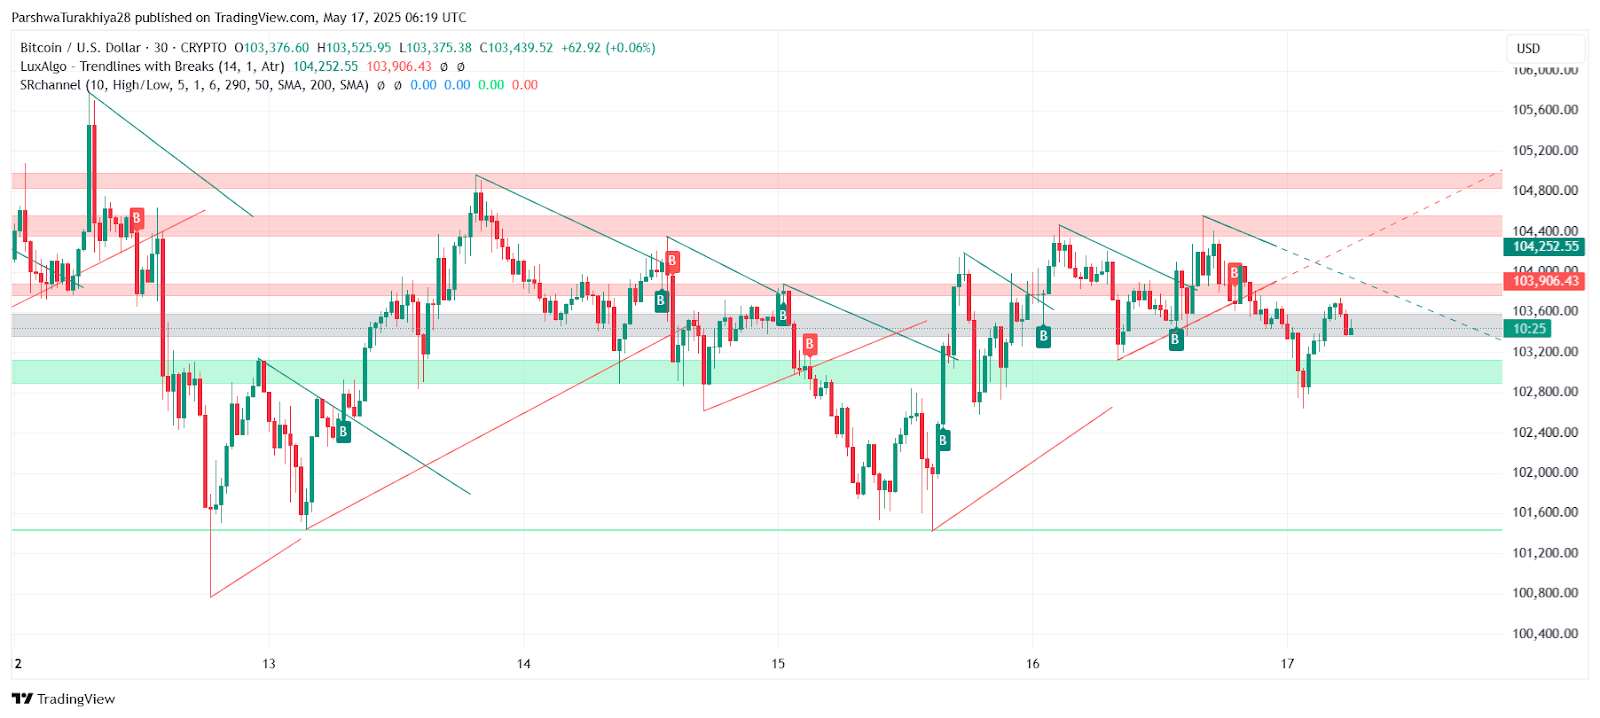
Shorter timeframes show conflicting momentum. On the 30-minute chart, RSI is neutral at 48.86 while the MACD has crossed above its signal line, showing early signs of bullish intent, though histogram bars remain modest. Meanwhile, the Ichimoku Cloud reflects consolidation, with the price hovering inside the cloud and Tenkan-Kijun lines flat — a typical pause phase before trend resumption.
 BTCUSD price dynamics (Source: TradingView)
On the 4-hour chart, Bollinger Bands have tightened significantly between $102,321 and $104,574, suggesting a volatility expansion is imminent. EMA 20 and 50 are converging near $103,500, adding more weight to this compression zone. A clean move above $104,300 on volume could trigger a breakout rally to $105,700 and eventually to the weekly resistance at $109,396.
Why Bitcoin Price Going Down Today?
 BTCUSD price dynamics (Source: TradingView)
The answer lies in waning buying pressure at major resistance and repeated intraday rejections near $104,500. Price has failed to close above this level despite several tests, pointing to seller dominance. Additionally, the upper Bollinger Band on the 4-hour chart capped price advances for the third consecutive session. Without a clear breakout, buyers may remain sidelined, especially with RSI unable to reclaim bullish territory above 50.
 BTCUSD price dynamics (Source: TradingView)
Moreover, on the weekly chart, BTC touched the Fib 0.786 level and retraced — a classic sign of exhaustion after a parabolic rise. This aligns with the daily lower highs structure and could signal a deeper correction if support zones fail.
Near-Term Outlook for May 18
 BTCUSD price dynamics (Source: TradingView)
For May 18, Bitcoin will likely stay in a squeeze between $103,000 support and $104,500 resistance unless macro volume triggers a breakout. If bulls can close a 4-hour candle above $104,300 with confirmation from RSI and MACD, a rally toward $105,700–$107,000 is probable. However, failure to hold $102,800 could invite retests of $101,500 and the key breakout zone near $100,800.
Until then, the trend remains cautiously bullish with strong support just below, but a clear breakout signal is needed for upside continuation.
Bitcoin Price Forecast Table
| Indicator / Zone | Level (USD) | Signal Description |
| Resistance 1 | 104,300 | Immediate breakout trigger |
| Resistance 2 | 105,700 | Weekly top rejection zone |
| Support 1 | 102,800 | Near-term demand area |
| Support 2 | 101,500 | Breakdown trigger |
| 4H EMA 50 | 102,533 | Dynamic support zone |
| RSI (30-min) | 48.86 | Neutral to slightly bearish |
| MACD (30-min) | Weak Bullish | Early bullish crossover |
| Ichimoku (30-min) | Inside Cloud | Rangebound bias |
| Bollinger Band (4H) Width | Tight | Breakout likely within 24h |
Disclaimer: The information presented in this article is for informational and educational purposes only. The article does not constitute financial advice or advice of any kind. Coin Edition is not responsible for any losses incurred as a result of the utilization of content, products, or services mentioned. Readers are advised to exercise caution before taking any action related to the company.