

- BNB signals a breakout past $690, with RSI and MACD trends aligning for potential highs above $1,000 by July 2025.
- Market Observers highlight a bull flag pattern near $649, projecting a $708 target if $632 support remains intact.
- Long-term indicators show momentum mirroring the 2020 rally; a confirmed breakout could trigger a cyclical wave to $1,000.
Binance Coin (BNB) is flashing major bullish signals following a confirmed breakout and technical divergence. Analysts now project a continuation move above $700, driven by renewed momentum and cyclical market patterns.
Hidden Bull Divergence, Bull Flag Align as BNB Aims Higher
BNB recently broke out from a long-term descending channel and now trades near $649, with analysts watching for a breakout past $708. Hidden bullish divergence on RSI and MACD signals further reinforces the setup. A confirmed move above $690 could set the stage for new multi-month highs by July 2025.
Long-Term Indicators Support a Bullish Case
 Source: Post on X
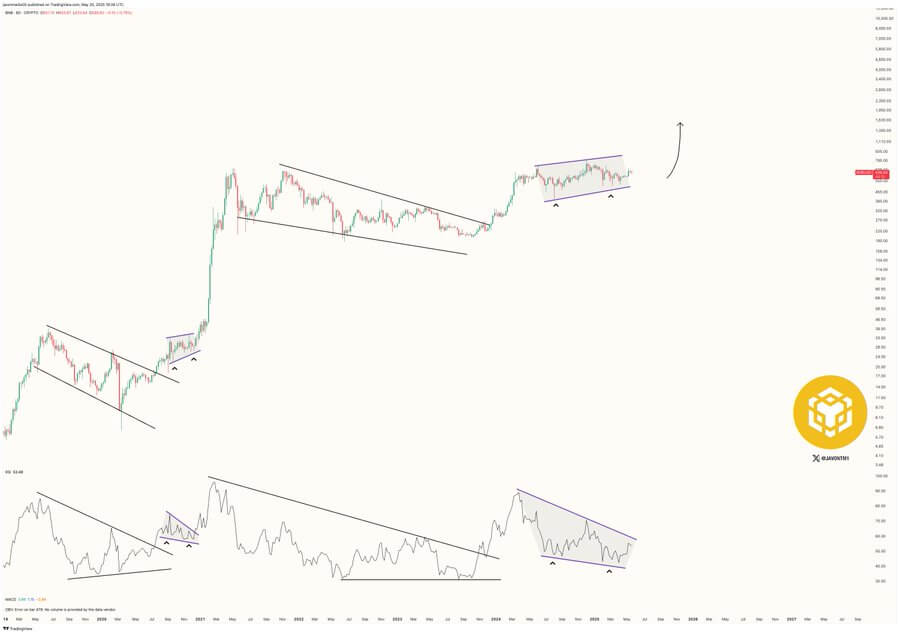
In the post shared above, Javon Marks has presented a detailed full-cycle analysis of BNB’s historical structure. His chart outlines key formations from 2019 through 2025, including two falling wedges and major RSI and MACD reversals. The latest pattern shares multiple similarities with the 2020 setup that preceded a 2,000% rally.
According to Marks, the RSI trendline was recently broken to the upside, with values now approaching 65. MACD histogram bars are rising above the zero line, mimicking previous expansion phases that marked the beginning of major rallies. The highlights how these movements mirror BNB’s earlier cycle, which also featured a double-bottom and momentum shift before breakout.
Javon marks $646 and $690 as critical resistance levels. If price clears these thresholds, it could trigger a run toward $1,000, similar to the accelerated wave seen after the 2020 breakout. The cyclical nature of these structures supports the probability of another extended bullish wave forming.
Short-Term Structure Shows Bull Flag Continuation Pattern
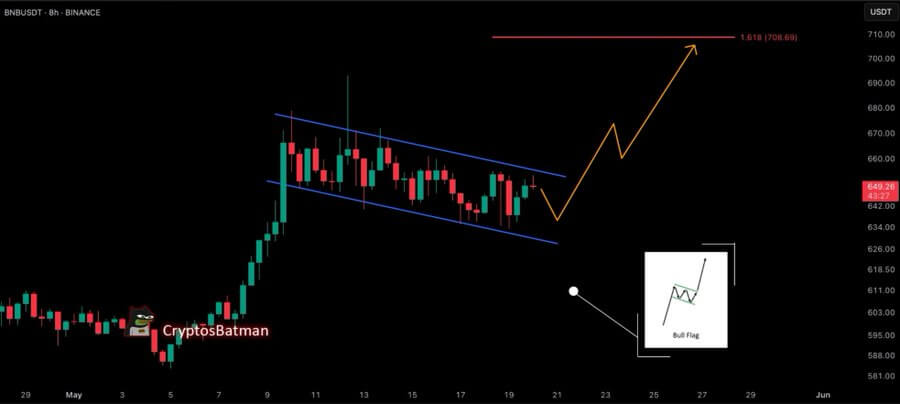
Another analyst, BATMAN, has provided insights using an 8-hour chart of BNB/USDT. He identifies a bull flag pattern developing after a steep rise from under $580 to $686. BNB price has since moved inside a narrow downward-sloping channel , forming lower highs and lower lows within the flag.
 Source: Post on X
This flag has formed over 11 days, showing decreasing volatility and increasing candle wicks, which often precedes a breakout. The projected breakout path begins near $640 and targets the 1.618 Fibonacci extension at $708.69. BATMAN’s schematic shows price reacting to both boundaries of the flag, with the current action pressing against upper resistance near $660.
Analysts observe that as long as the price stays above $632, the structure remains valid. This range has consistently held during the cooldown phase, instilling confidence in the continuation outlook. Structural invalidation would only occur on a clean breakdown below the support.
The bullish outlook is sustained while BNB holds its current range and builds momentum toward the upper trendline. According to Experts, a breakout above $690 could spark another sharp leg upward, continuing the pattern observed in previous rallies.