
Six Key Metrics to Consider: What Will Be Bitcoin's Price by the End of This Year?

It is expected that BTC will reach between $210,000 and $230,000 by the end of 2025.
Original Title: What will BTC's price be by the end of 2025?
Original Author: ElonMoney Research
Original Translation: Felix, PANews
This article's analysis utilizes indicators such as MVRV Z-Score, Energy Value Oscillator, Bitcoin Heater, and historical data. Although historical data is a valuable reference, its accuracy may be reduced in the current environment, as the 2021 cycle lacked participants such as Strategy, Metaplanet, and ETF.
MVRV Z-Score
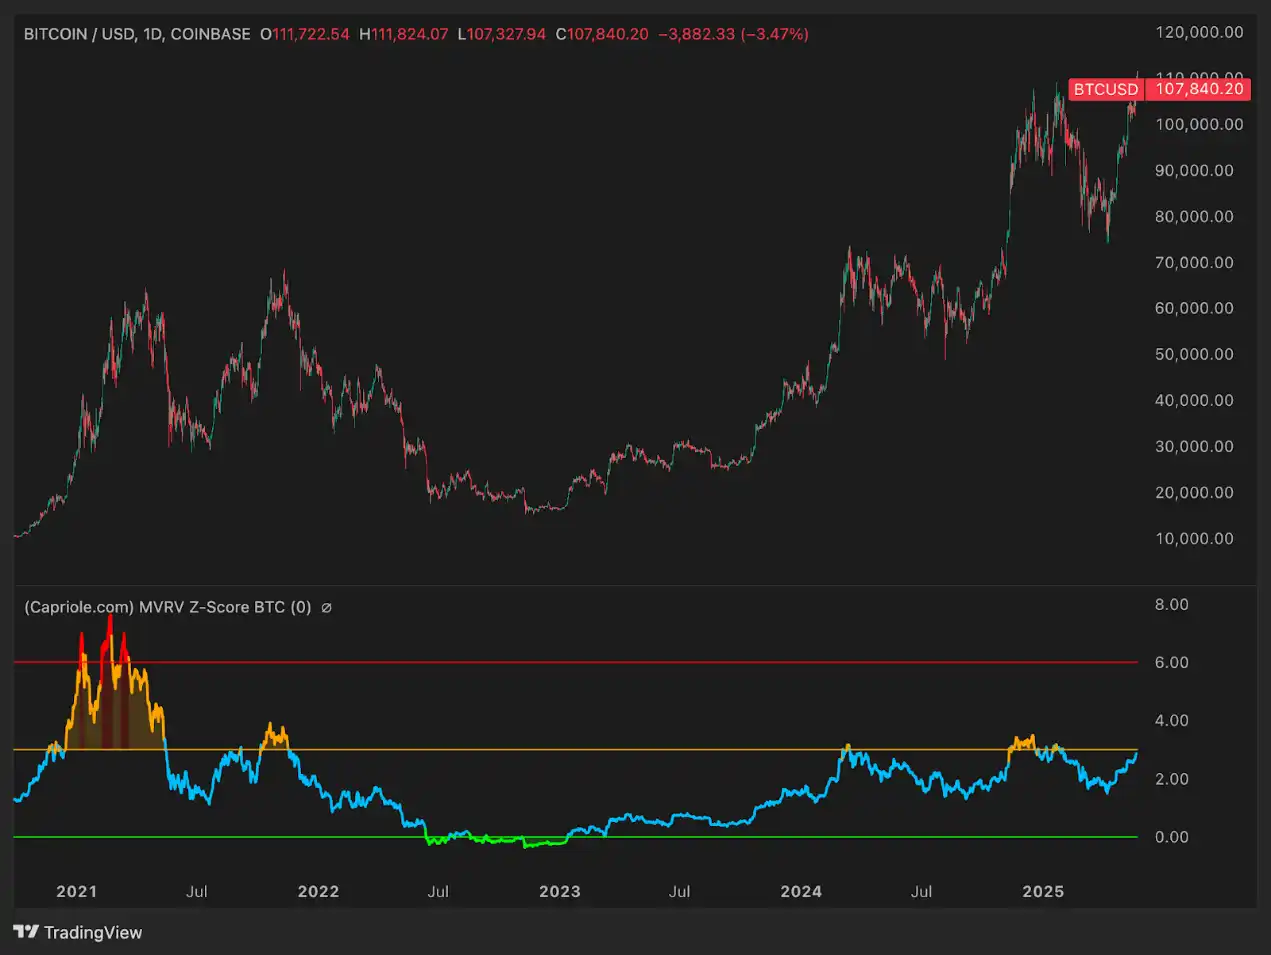
The MVRV Z-Score indicator is a measure of market valuation that seeks to identify market cycle tops and bottoms by comparing the degree to which an asset is overvalued or undervalued relative to its fair value. The chart shows the current MVRV Z-Score to be around 2 to 3, in a neutral zone, far from the overheated values seen at market tops. Historically, the peak of the Bitcoin cycle pushes this indicator into the red zone (around 7 to 9), indicating a significant disconnect between market cap and realized cap. Today, the indicator is slightly above 2, in the blue/yellow area, suggesting that Bitcoin is not overvalued.
For context: At the beginning of 2021, before Bitcoin reached around $60,000 to $65,000, this indicator had exceeded 7. During the bear market of 2022, this indicator dropped below 0 (green zone), indicating an oversold market. From a technical perspective, there is still significant upside potential at the current level before this cycle ends. Even if Bitcoin were to reach around $100,000 to $110,000, by MVRV standards, Bitcoin would not be considered "expensive." If Bitcoin follows the structural form of past tops, the MVRV Z-Score indicator is expected to rise to 5 to 7 or higher.
This implies that the future market will have significant upward potential. The basic inference suggests that based on MVRV, tops often occur when the BTC trading price is well above $100,000—potentially over $200,000, depending on changes in realized cap in the coming months.
Energy Value Oscillator
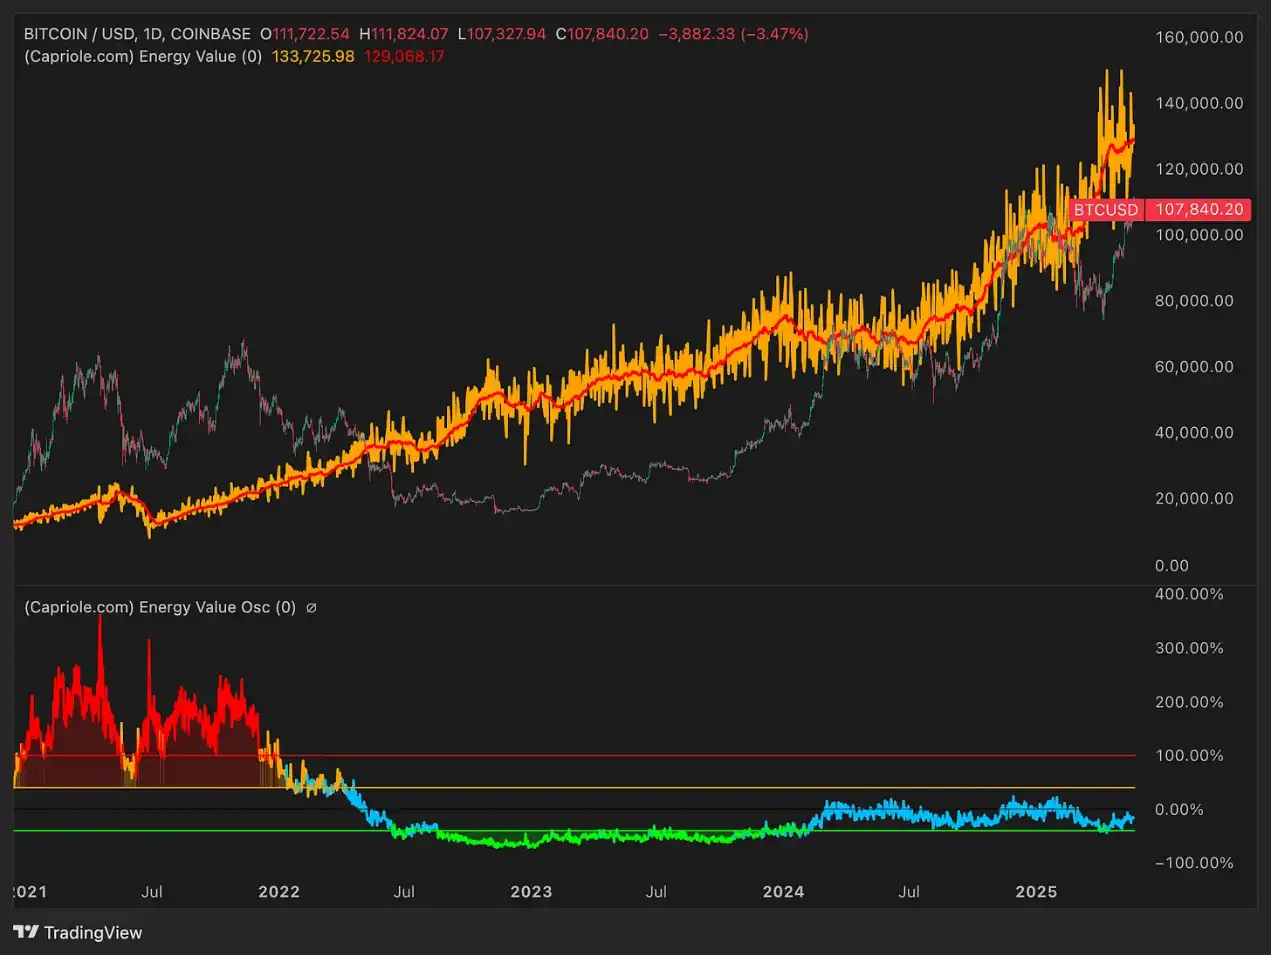
This indicator measures Bitcoin's "fair value" based on total energy (Energy Value = Hash Rate × Energy Efficiency). The red-orange line in the chart above represents the energy-based fair value of Bitcoin—around $130,000 by mid-2025. The blue oscillation indicator below tracks the deviation of the current price from this benchmark.
Historically, when the Bitcoin trading price is significantly higher than its energy value, the oscillation indicator enters the red zone (over 100% valuation). In early 2021, when Bitcoin's price was around $60,000, it was over 100% above its energy value. Conversely, in 2022, Bitcoin's trading price was below its energy value, and the oscillator was in the green (undervalued) zone.
Currently, the oscillator is near zero, indicating that Bitcoin's trading price ($107,000 to $110,000) is 10% to 20% below the model-calculated fair value. This suggests that Bitcoin is not overheated. If by the second half of 2025 the energy value reaches around $150,000 and there is a 50% to 100% premium trading price (common near cycle peaks), this would imply a price range of $225,000 to $300,000. In other words, the Energy Value Oscillator confirms that Bitcoin still has significant upside potential. Before the oscillator breaks above +100%, by this standard, the market is unlikely to be in a state of "extreme overvaluation."
Bitcoin Heater (Derivative Overheat Indicator)
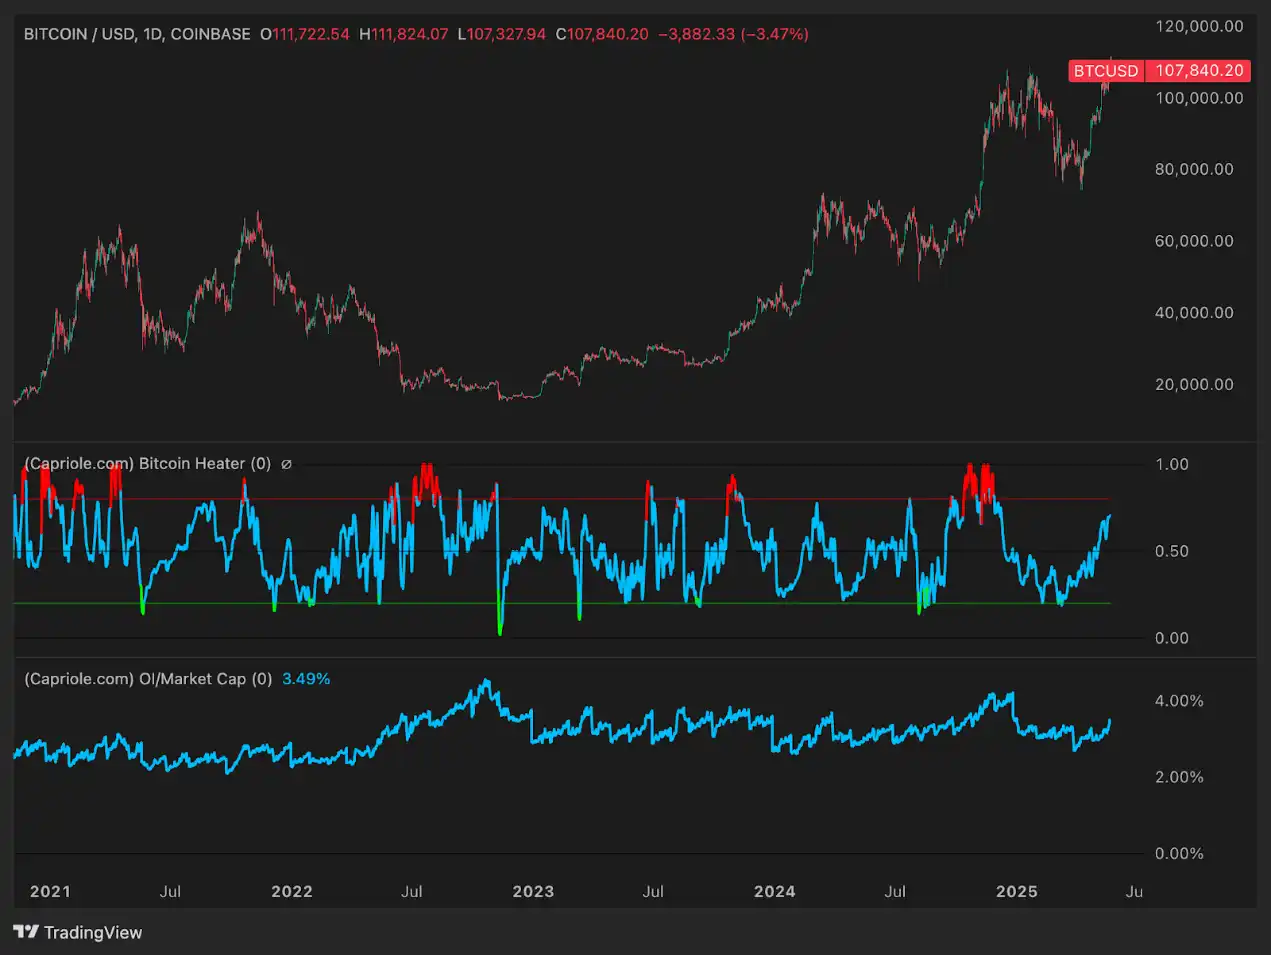
The Bitcoin Heater indicator consolidates derivative sentiments (funding rate, basis, option skew) into a single index between 0 and 1. A value close to 1.0 indicates a bubble, aggressive long positions, and high leverage. The indicator around 0.0 to 0.3 signifies a cooling-off of the market or risk-off sentiment. In previous cycles (especially in 2021), this indicator often broke above 0.8 before local corrections. However, in a strong bull market period (fourth quarter of 2020 to first quarter of 2021), the indicator remained at high levels but did not immediately trigger a reversal. By mid-2025, this indicator is around 0.6 to 0.7, indicating a warm state but not overheated.
This suggests that we have not yet entered the frenzy late stage of the cycle. In the final uptrend phase, this indicator may reach 0.8 to 1.0. Until then, the market still has room to grow. Periodically exceeding 0.8 before the peak is reasonable, but the ultimate peak is likely to align with prolonged periods of the red zone in the indicator.
Macro Index Oscillation Indicator
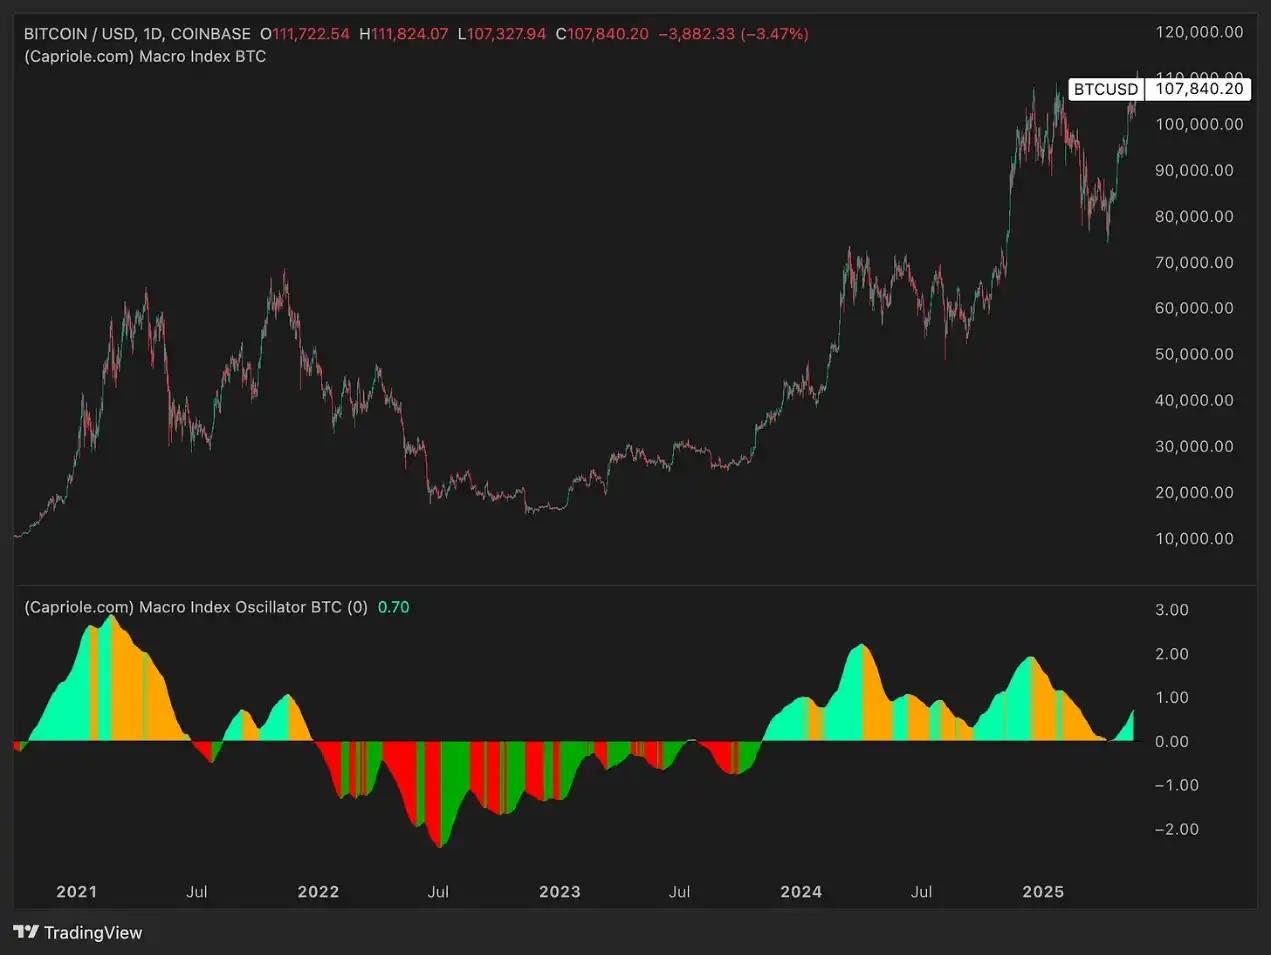
This composite index uses over 40 fundamental, on-chain, and market indicators to assess Bitcoin's macro phase. The index above 0 indicates expansion; below 0 indicates contraction or recovery. In the previous bull market cycle, the indicator transitioned from a negative value range to a strong positive value range—peaking around 2 to 3 in 2021. In 2022's bottom, the indicator dipped below -1. Currently, the macro index is around +0.7—clearly in a growth phase but still far below the extreme euphoria levels.
This suggests that the current cycle may be in the mid-phase of expansion. It is expected that as the cycle progresses towards the end of 2025, the indicator will climb to 2.0 or above. Bitcoin still has room to grow until there are signs of stagnation or reversal in core network activity. There are currently no signs of fatigue.
Volume Summer (Liquidity/Participation)
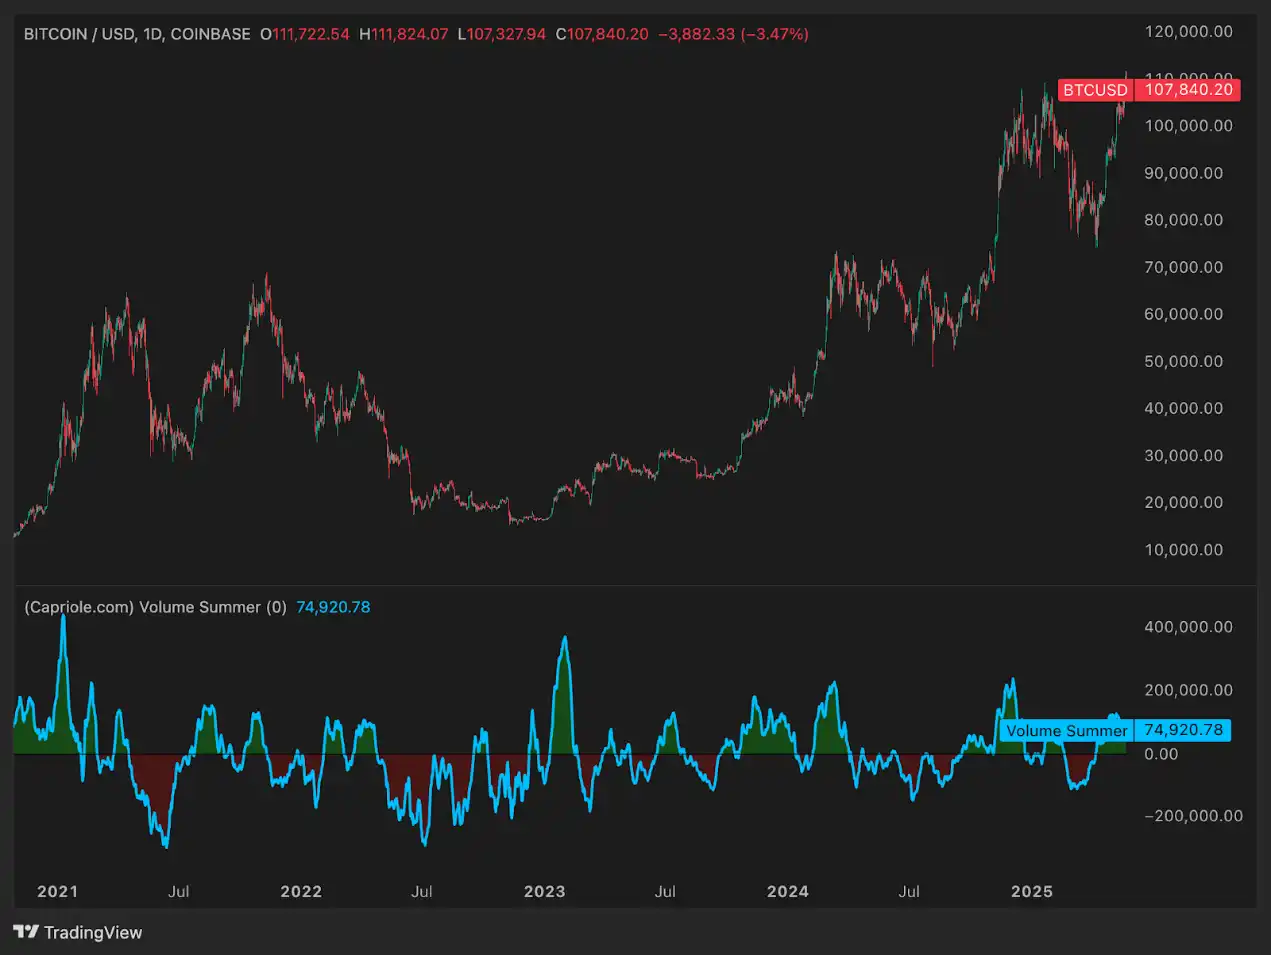
Volume Summer aggregates the net buyer trading volume from the spot and derivative markets. The indicator above zero indicates net inflows; below zero indicates net outflows or decreased trading activity. In early 2021, this indicator surged into the bright green zone—a sign of retail FOMO and enthusiastic participation. In 2022, the indicator plummeted into the red zone, confirming a significant fund exodus.
The current Volume Summer indicator is mildly positive (around +7.5k)—bullish but far from euphoric levels. This suggests that funds are returning, but the peak liquidity phase may still lie ahead (Q4 2025?). If this indicator spikes back into the deep green zone, a price surge is expected. At the current level, liquidity provides support—but has not peaked yet. There is still more momentum to drive further gains.
Open Interest/Market Cap Ratio (OI/Mcap)
This indicator measures the leverage ratio relative to market cap. In 2021, the indicator hovered between 2% to 3%. By 2023, the indicator soared to around 4%, setting the stage for the mid-2024 correction. After a market crash, the indicator reset to 2%, clearing excess leverage.
As of mid-2025, the indicator has risen back to approximately 3.5%. This indicates a rising leverage ratio. While beneficial for short-term market upside (providing more momentum for the uptrend), it also increases risk. If the indicator rises to 4% - 5% or above by year-end, it may signal a crowded and unstable market prone to sell-offs. The final stage of this cycle may be characterized by record-high leverage ratios at the price peak. However, there is still upside potential at present.
Possible BTC Trend in December This Year
Considering all indicators, it is expected that BTC is currently in the core stage of a bull market cycle but has not yet reached its end. There are currently no extreme signals of overvaluation. Most indicators show strong growth but are still below levels seen at historical cycle tops. Therefore, the primary prediction is that BTC will reach between $210,000 and $230,000 by the end of 2025, more than doubling its current level. Based on these valuations, the following are expected:
· MVRV Z-Score > 7
· Energy Value Oscillator > +100%
· Bitcoin Heater around 1.0
· Volume Summation in the excitement zone
· OI/Mcap at a historical extreme level
Only then is it possible for this market to transition from an expansion phase to a distribution phase. Related reading: Bitcoin Hits New High, What Are the Four Major Catalysts for the Subsequent Market?
Disclaimer: The content of this article solely reflects the author's opinion and does not represent the platform in any capacity. This article is not intended to serve as a reference for making investment decisions.
You may also like
New spot margin trading pair — HOLO/USDT!
FUN drops by 32.34% within 24 hours as it faces a steep short-term downturn
- FUN plunged 32.34% in 24 hours to $0.008938, marking a 541.8% monthly loss amid prolonged bearish trends. - Technical breakdowns, elevated selling pressure, and forced liquidations highlight deteriorating market sentiment and risk-off behavior. - Analysts identify key support below $0.0080 as critical, with bearish momentum confirmed by RSI (<30) and MACD indicators. - A trend-following backtest strategy proposes short positions based on technical signals to capitalize on extended downward trajectories.

OPEN has dropped by 189.51% within 24 hours during a significant market pullback
- OPEN's price plummeted 189.51% in 24 hours to $0.8907, marking its largest intraday decline in history. - The token fell 3793.63% over 7 days, matching identical monthly and yearly declines, signaling severe bearish momentum. - Technical analysts cite broken support levels and lack of bullish catalysts as key drivers of the sustained sell-off. - Absence of stabilizing volume or reversal patterns leaves the market vulnerable to further downward pressure.

New spot margin trading pair — LINEA/USDT!