

Ethereum is trading within a tightening structure heading into June 10, showing signs of consolidation following a volatile week. After rejecting near the $2,540–$2,560 zone, the asset has slipped toward the $2,500 handle, a critical short-term support. The broader technical outlook suggests indecision, with bulls defending key moving averages while momentum indicators flash warning signals.
What’s Happening With Ethereum’s Price?
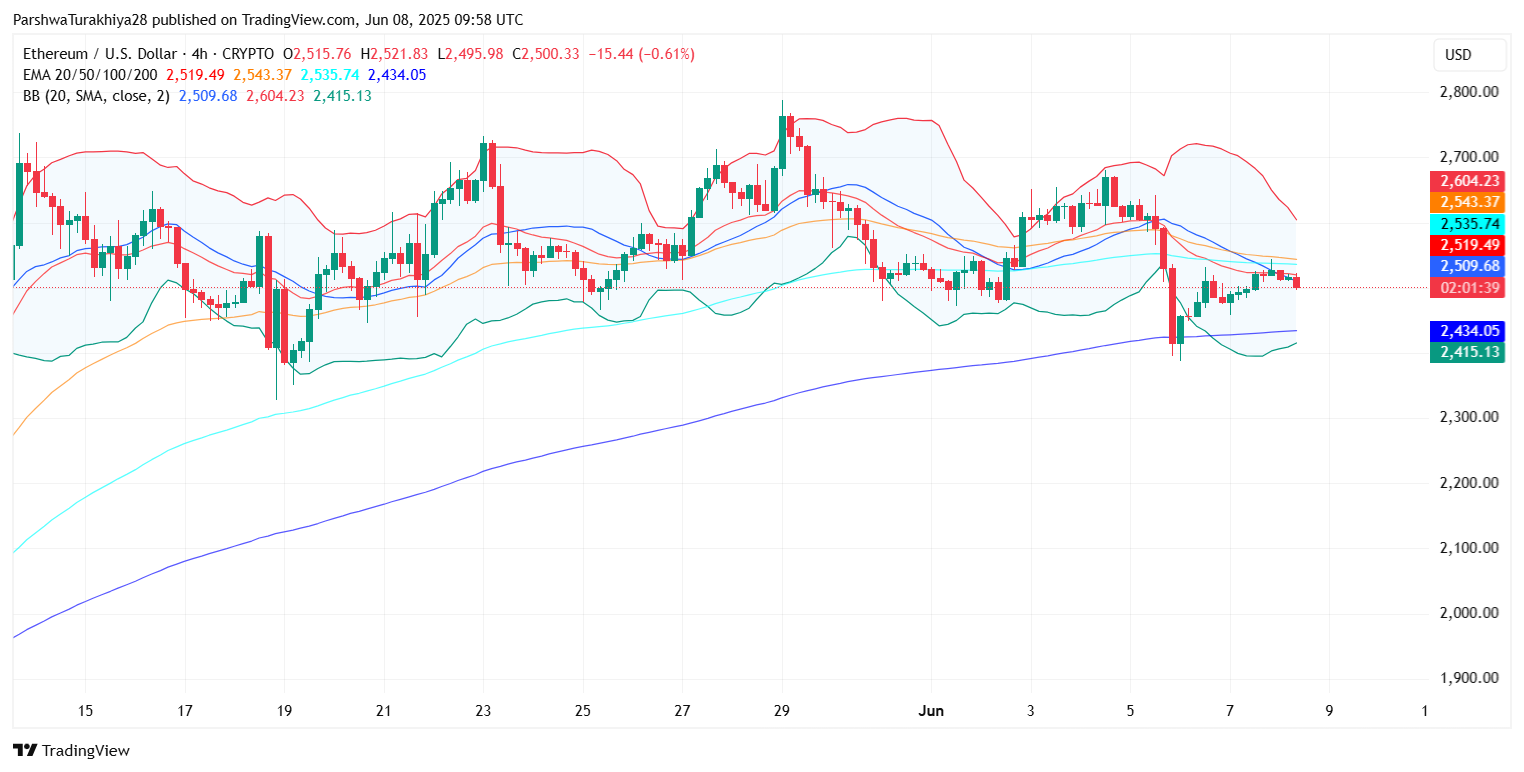
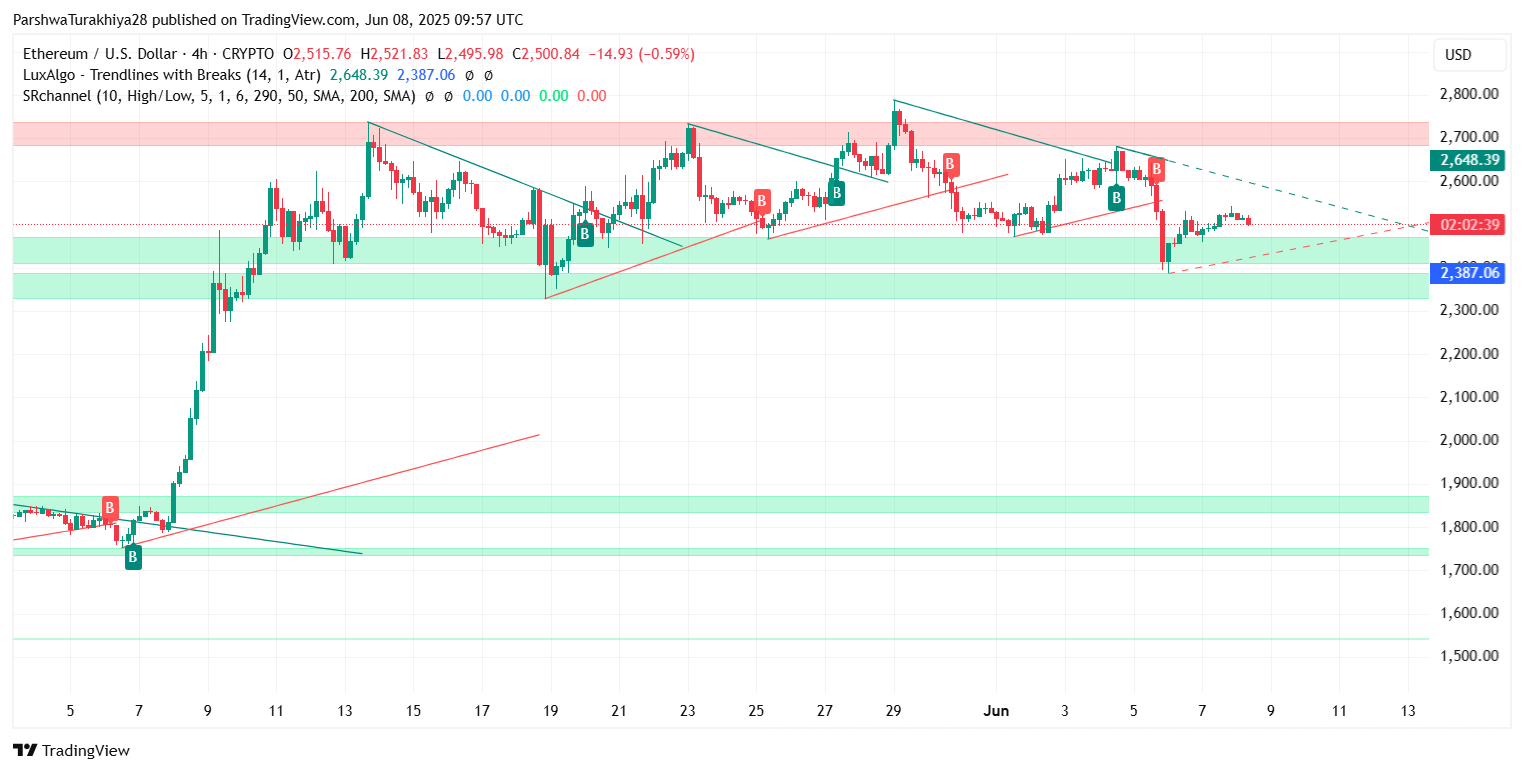
The Ethereum price today stands near $2,500, struggling to maintain traction after a failed breakout above the mid-$2,500s. On the 4-hour chart, the price is hovering just below the 20-EMA ($2,519) and attempting to stay within the Bollinger Bands middle band ($2,509). Multiple EMA clusters around the $2,519–$2,535 zone act as dynamic resistance, while downside protection begins near $2,435.
 ETH price dynamics (Source: TradingView)
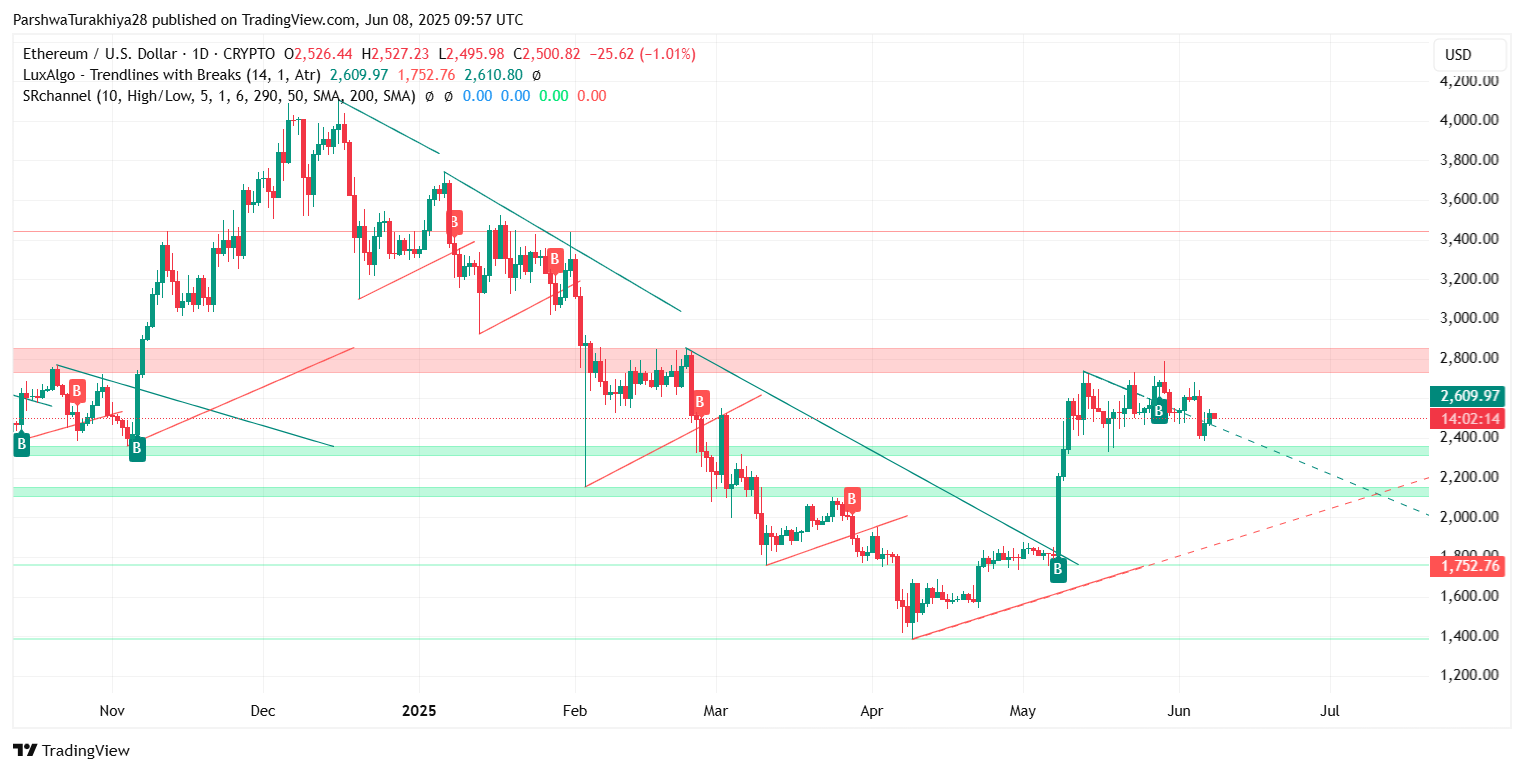
The Ethereum price action earlier in the week featured a sharp intraday sell-off from $2,560, as reflected on the 30-minute and daily timeframes. This created a shooting star candle on the 1D chart, which historically signals exhaustion and potential pullback. Price is currently respecting the lower bound of a descending wedge and has yet to break decisively in either direction.
RSI and MACD Indicators Reflect Bearish Divergence
 ETH price dynamics (Source: TradingView)
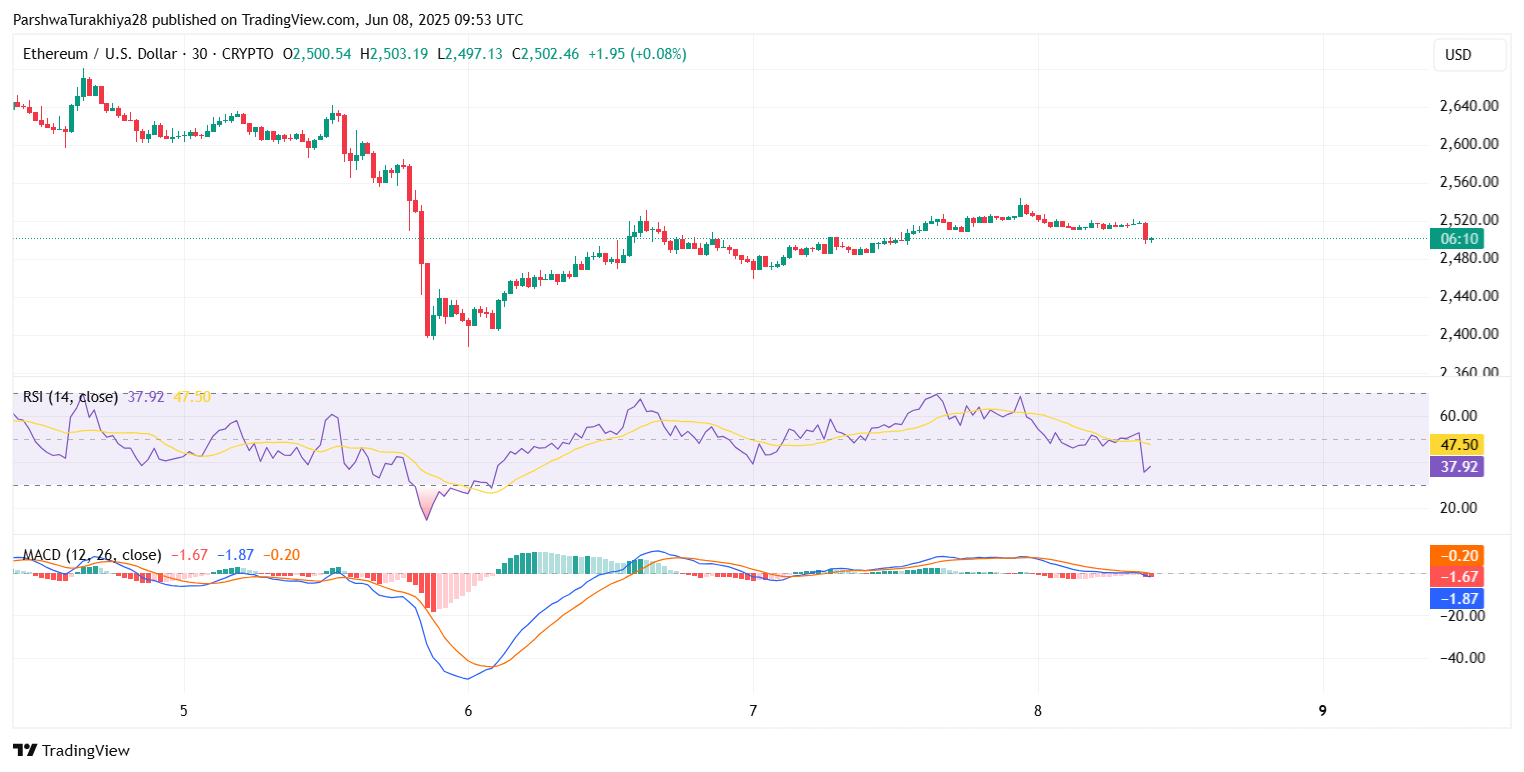
Looking at short-term momentum, the RSI on the 30-minute chart sits at 37.92, dipping from overbought levels while remaining below its signal line. The MACD histogram is flatlining, with the signal and MACD lines slightly bearish (−1.87 and −0.20 respectively). This suggests that upside momentum is fading, especially after the rejection from $2,540.
On the 4-hour chart, the RSI is still neutral but leaning lower, while the MACD remains capped under the zero line, indicating bearish divergence between price and momentum—a condition that could fuel further consolidation or even retracement.
Ichimoku and Bollinger Bands Show Cloud Resistance
 ETH price dynamics (Source: TradingView)
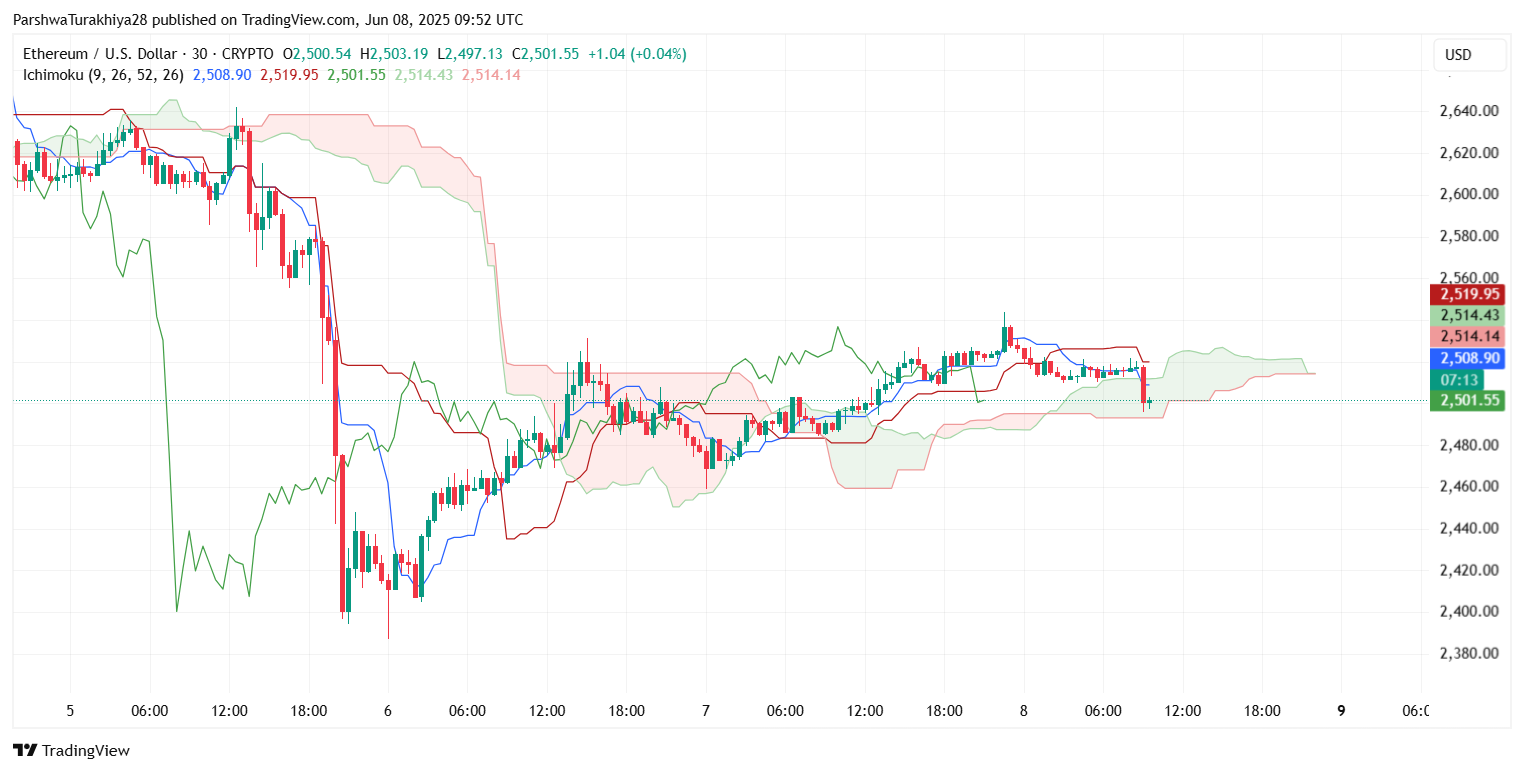
The Ichimoku Cloud on the 30-minute chart shows Ethereum trapped below the Kijun-sen ($2,514) and Tenkan-sen ($2,519), both of which are declining. Price remains within the cloud, suggesting indecision, while the future cloud is flat and thin—typically a sign of low conviction in either direction. This aligns with the narrowing Bollinger Bands, which signal incoming Ethereum price volatility.
Key Zones for Breakout or Breakdown
 ETH price dynamics (Source: TradingView)
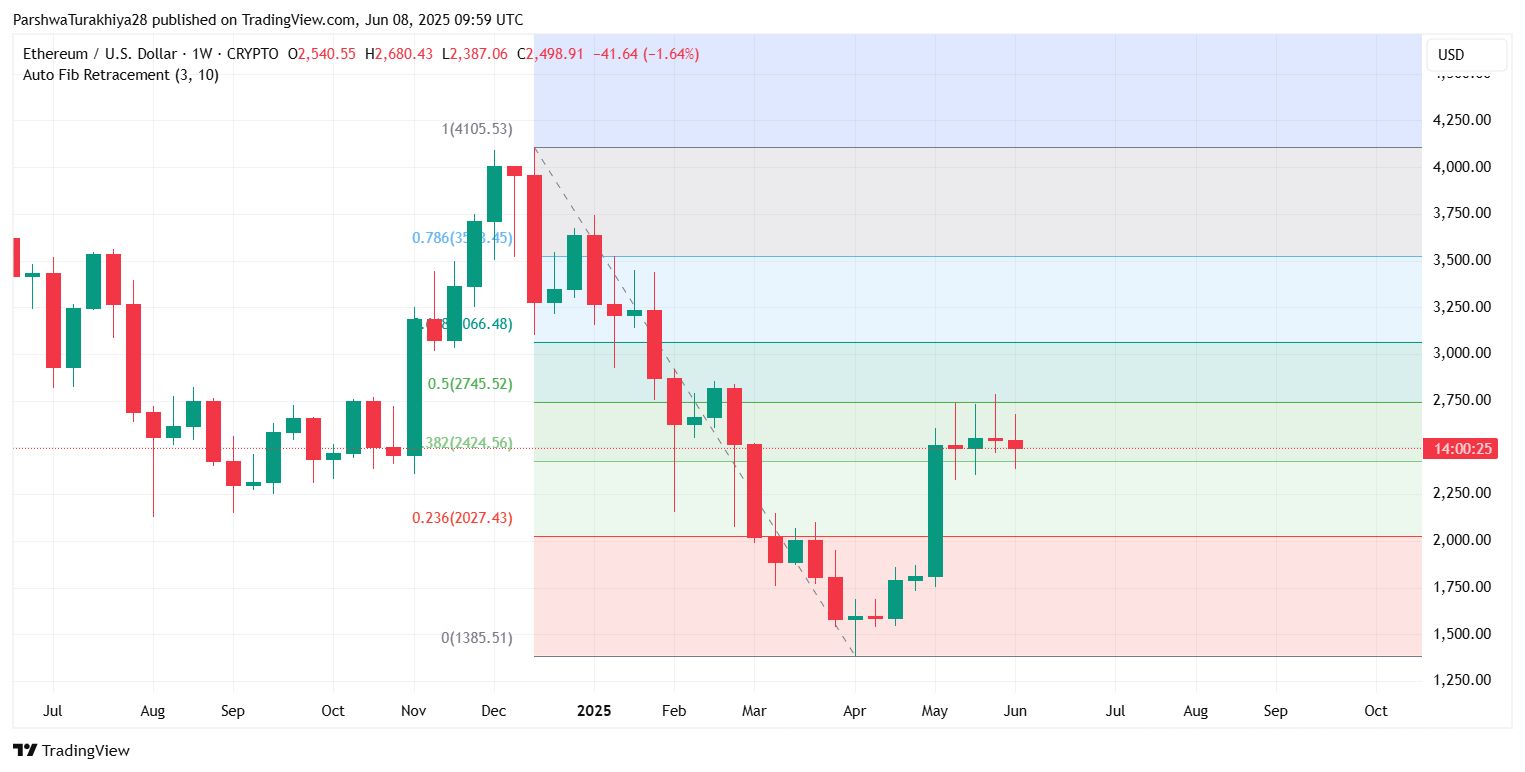
On the 4H and daily timeframes, Ethereum is forming a converging wedge. Resistance lies at $2,535–$2,550, while support extends from $2,434 to $2,415. A break above the $2,560 region could reignite bullish momentum toward $2,648 and possibly $2,745 (Fibonacci 0.5 level), though it would require strong volume confirmation.
On the downside, a failure to hold $2,434 may push Ethereum toward the psychological $2,387–$2,300 zone, which coincides with the broader trendline support visible on the weekly chart.
Why Ethereum Price Going Down Today
 ETH price dynamics (Source: TradingView)
The answer to why Ethereum price going down today is rooted in the market’s struggle to sustain higher levels above $2,550 despite multiple attempts. Short-term holders have likely taken profit around resistance zones, and with RSI weakening across timeframes, traders are turning cautious. Additionally, the Ethereum/Bitcoin ratio has shown weakness, suggesting capital rotation away from ETH for now.
Ethereum Price Prediction for June 10
 ETH price dynamics (Source: TradingView)
If Ethereum holds above $2,434 and breaks above $2,560 with volume, the next upside targets are $2,648 and $2,745. However, failure to hold the $2,500–$2,480 level may bring further pressure toward $2,387, which aligns with weekly Fibonacci levels.
The Ethereum price update remains neutral-to-bearish in the very short term, but bulls still have a chance to reclaim momentum if the lower wedge support holds. A breakout from this compression phase will likely set the tone for the rest of June.
Forecast Summary Table
| Level/Indicator | Value/Zone | Interpretation |
| Ethereum price today | $2,500 | Holding above critical support |
| Immediate Resistance | $2,535–$2,560 | Must break to confirm short-term rally |
| Key Support | $2,434–$2,415 | Breakdown risks testing $2,387 |
| RSI (30m / 4h) | 37.92 / ~47 | Weak to neutral, trending down |
| MACD (30m) | Slightly bearish | Bearish divergence present |
| Ichimoku (30m) | Bearish bias | Price below cloud and base lines |
| Fib Levels (Weekly) | $2,648 / $2,745 | Key targets if breakout occurs |
Disclaimer: The information presented in this article is for informational and educational purposes only. The article does not constitute financial advice or advice of any kind. Coin Edition is not responsible for any losses incurred as a result of the utilization of content, products, or services mentioned. Readers are advised to exercise caution before taking any action related to the company.