Date: Thu, July 24, 2025 | 05:58 PM GMT
The cryptocurrency market is regaining momentum after a recent dip, with Ethereum (ETH) jumping over 3% today. This positive shift in sentiment is spilling into major altcoins , and Sui (SUI) is emerging as one of the tokens showing strong signs of further upside potential.
The layer 1 token has risen 4% today, extending its monthly rally to 37%. More importantly, its daily price chart is highlighting a well-defined harmonic pattern that could pave the way for a significant bullish move.
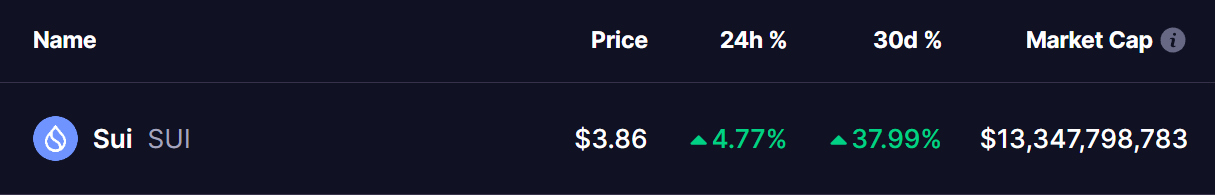 Source: Coinmarketcap
Harmonic Pattern Hints at Bullish Continuation
On the daily chart, SUI is forming a Bearish ABCD harmonic pattern — a structure that, despite its bearish name, is known for producing a powerful bullish CD leg before any potential reversal. The pattern started in April from Point A, rallied sharply to Point B, and then retraced to Point C near $2.29 by late June.
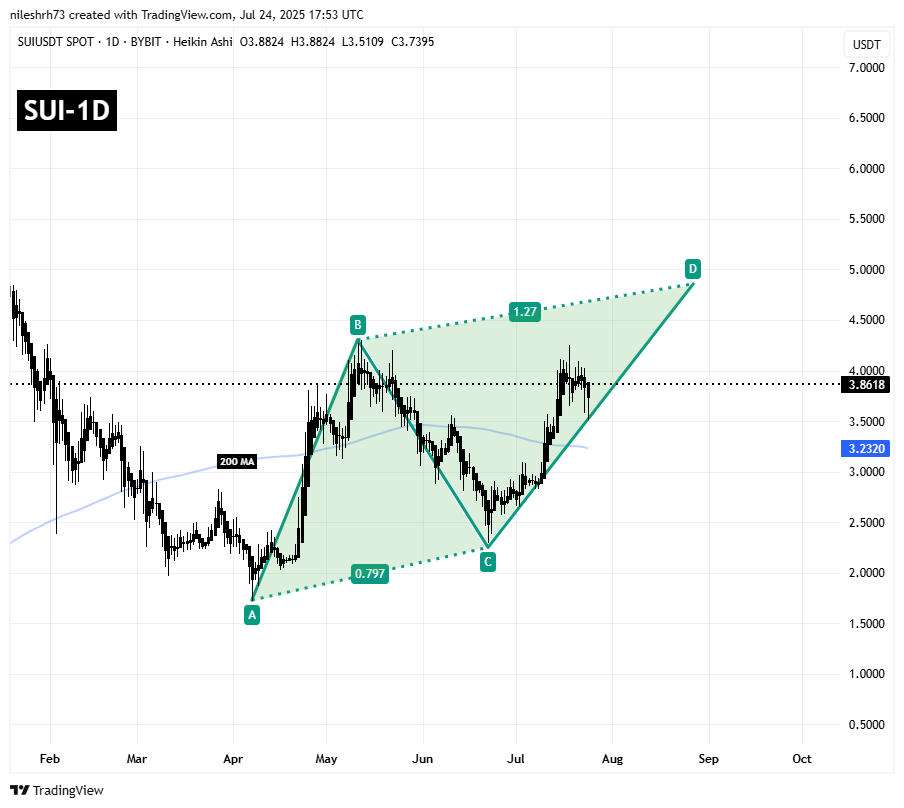 Sui (SUI) Daily Chart/Coinsprobe (Source: Tradingview)
Since bottoming at Point C, SUI has rebounded with strength, now trading near $3.86. The final CD leg is still developing, and if SUI continues to mirror the classic ABCD framework, the move could complete around the 1.272 Fibonacci extension of the BC leg. This projects a target near $4.85, which marks the Potential Reversal Zone (PRZ).
What’s Next for SUI?
If the CD leg plays out as expected, SUI could climb another 25% toward the $4.85 level. This area represents a critical resistance zone where traders typically watch for signs of profit-taking or a short-term pullback.
However, until the PRZ is reached, the trend remains in favor of the bulls, and momentum indicators point to more upside in the near term.