
8k BTC Sell Pressure Test Passed, How Far to 14k BTC Accumulation?

Bitcoin Hodlers' Unrealized Profit Hits Historic $1.4 Trillion Peak as Key Price Level of $14K Reached by Whales.
Original Article Title: Weekend Stress Test
Original Article Author: UkuriaOC, CryptoVizArt, Glassnode
Original Article Translation: AididiaoJP, Foresight News
This past weekend, Bitcoin's liquidity faced a significant test as an early investor sold over 80,000 BTC through Galaxy Digital's OTC trading service. Despite this, the market showed strong resilience, with the majority of investors choosing to hold rather than realize paper gains.
Execution Summary
Bitcoin's liquidity faced a serious challenge last weekend as an early large-scale investor sold over 80,000 BTC through Galaxy Digital's OTC trading service. Although this massive $9.6 billion sell-off put pressure on the market, it quickly absorbed the sell pressure, causing the price to briefly drop to $115,000 before swiftly stabilizing at $119,000, slightly below the all-time high.
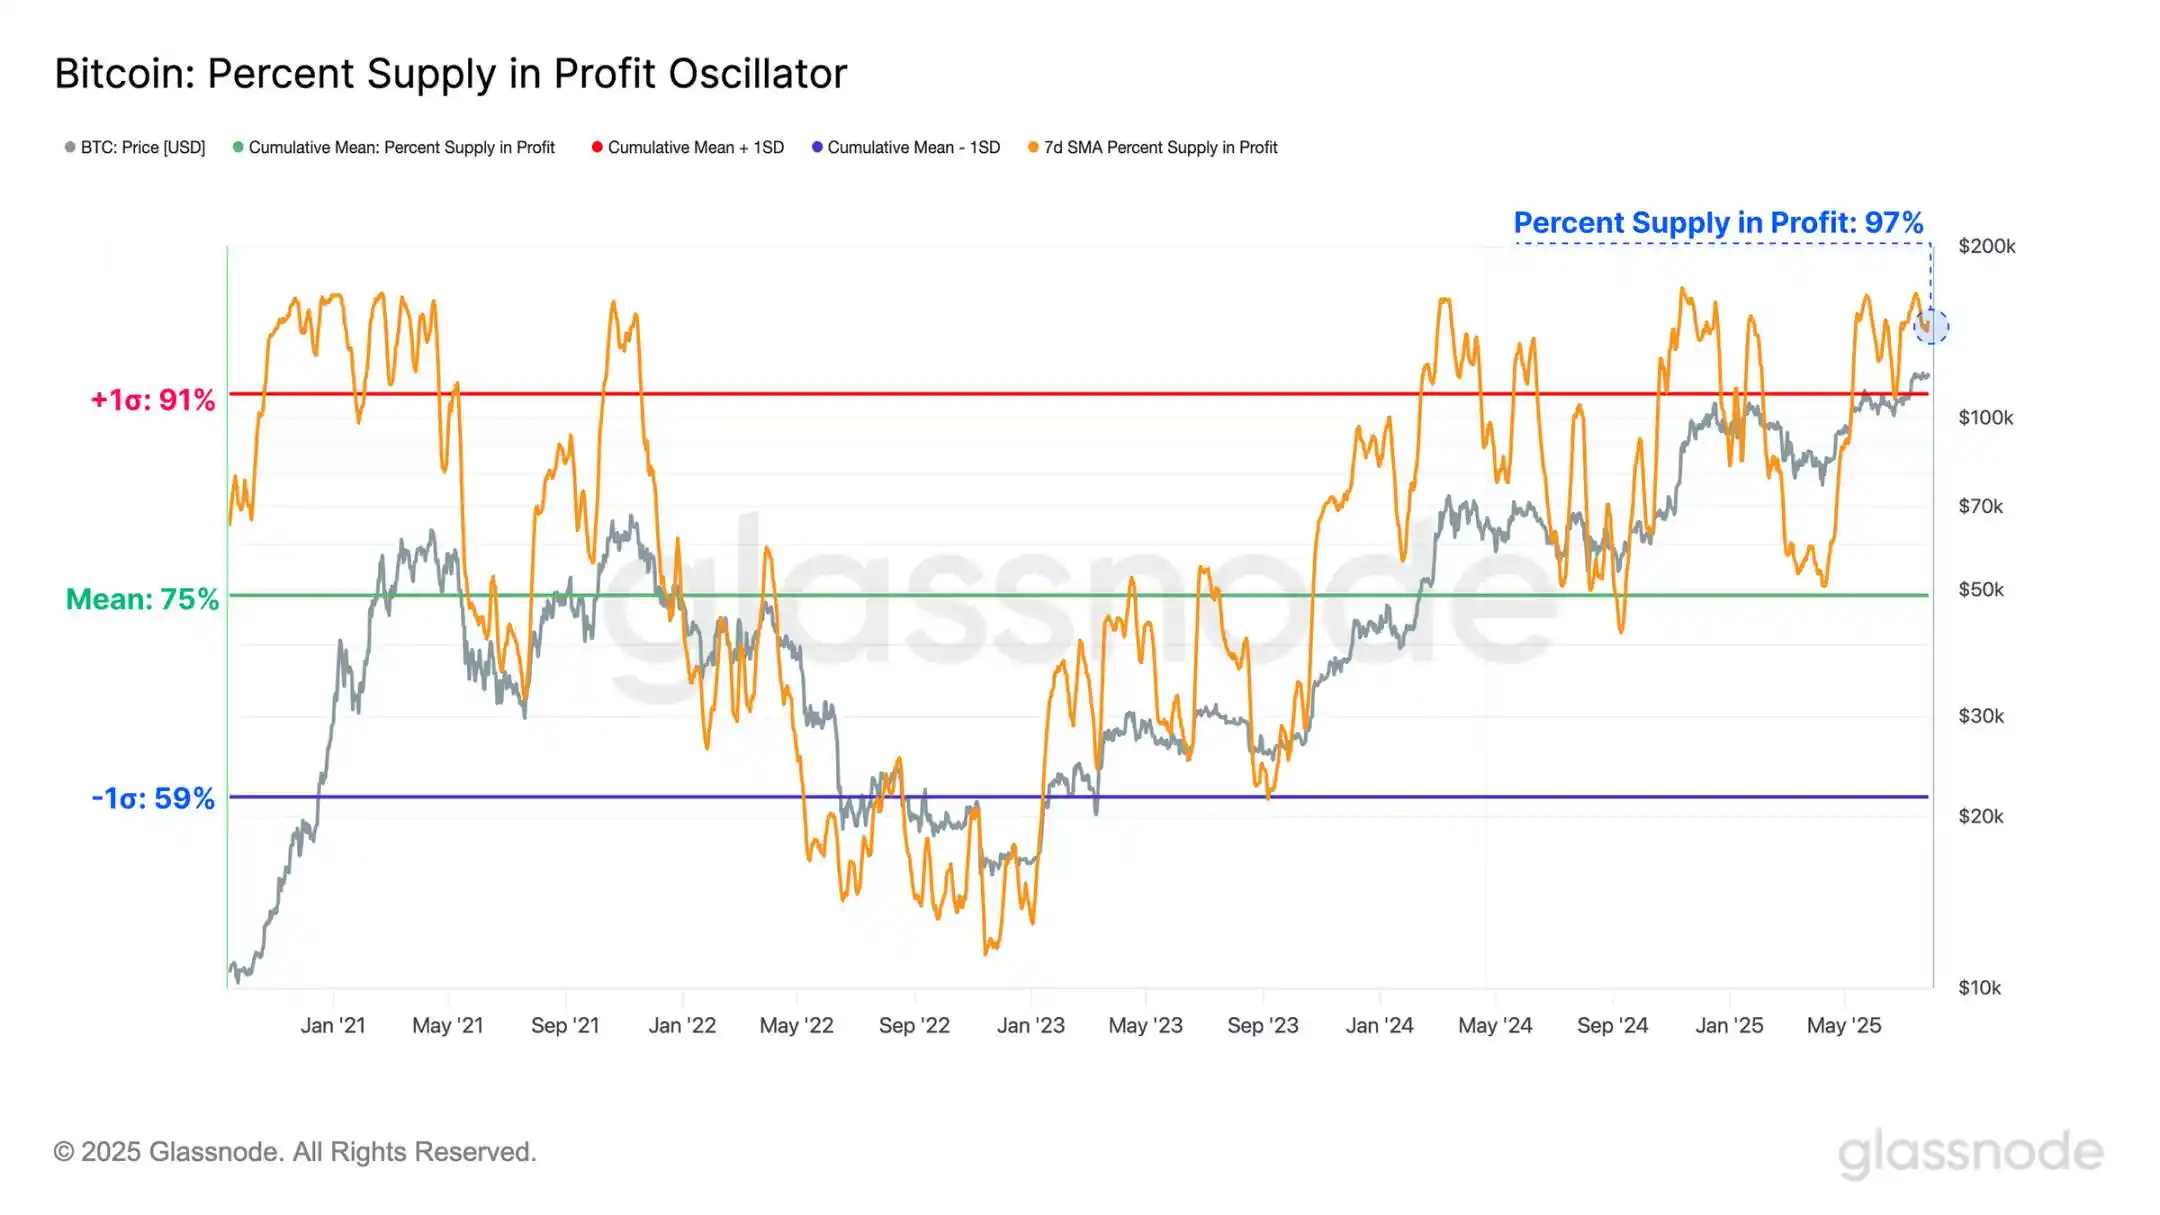
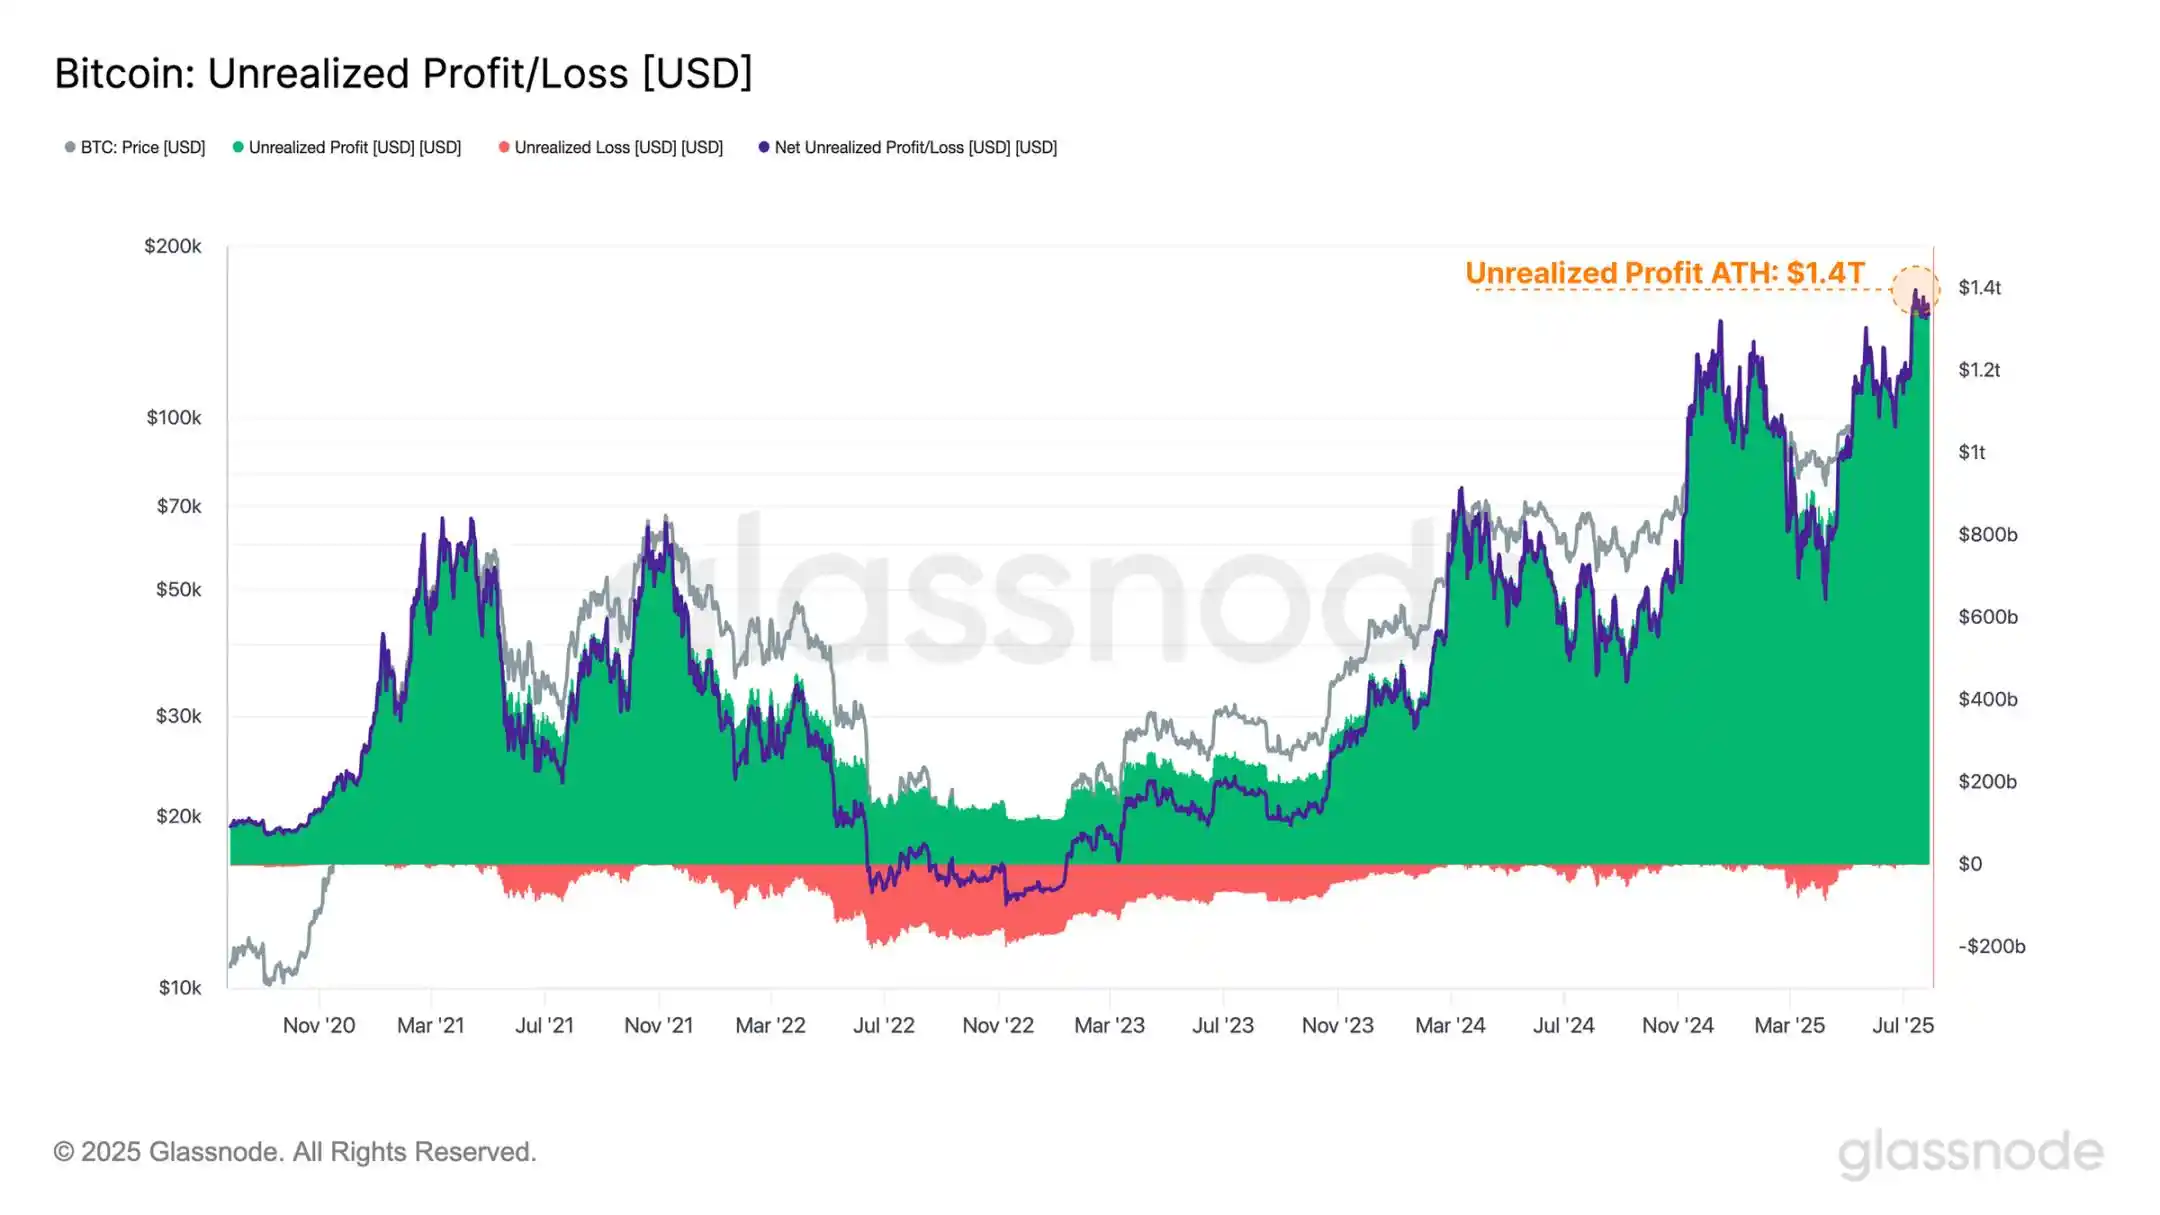
Even after such a massive sell-off event, the scale of unrealized profits held by market participants remains significant. The current total unrealized profit amounts to a staggering $1.4 trillion, with 97% of the circulating supply still in a profitable state.
According to various on-chain valuation models, the Bitcoin price is currently ranging between $105,000 and $125,000. If a successful breakout is achieved, the price may further test $141,000, which is expected to see a significant amount of unrealized profit realization and could face significant selling pressure.
Deep Liquidity
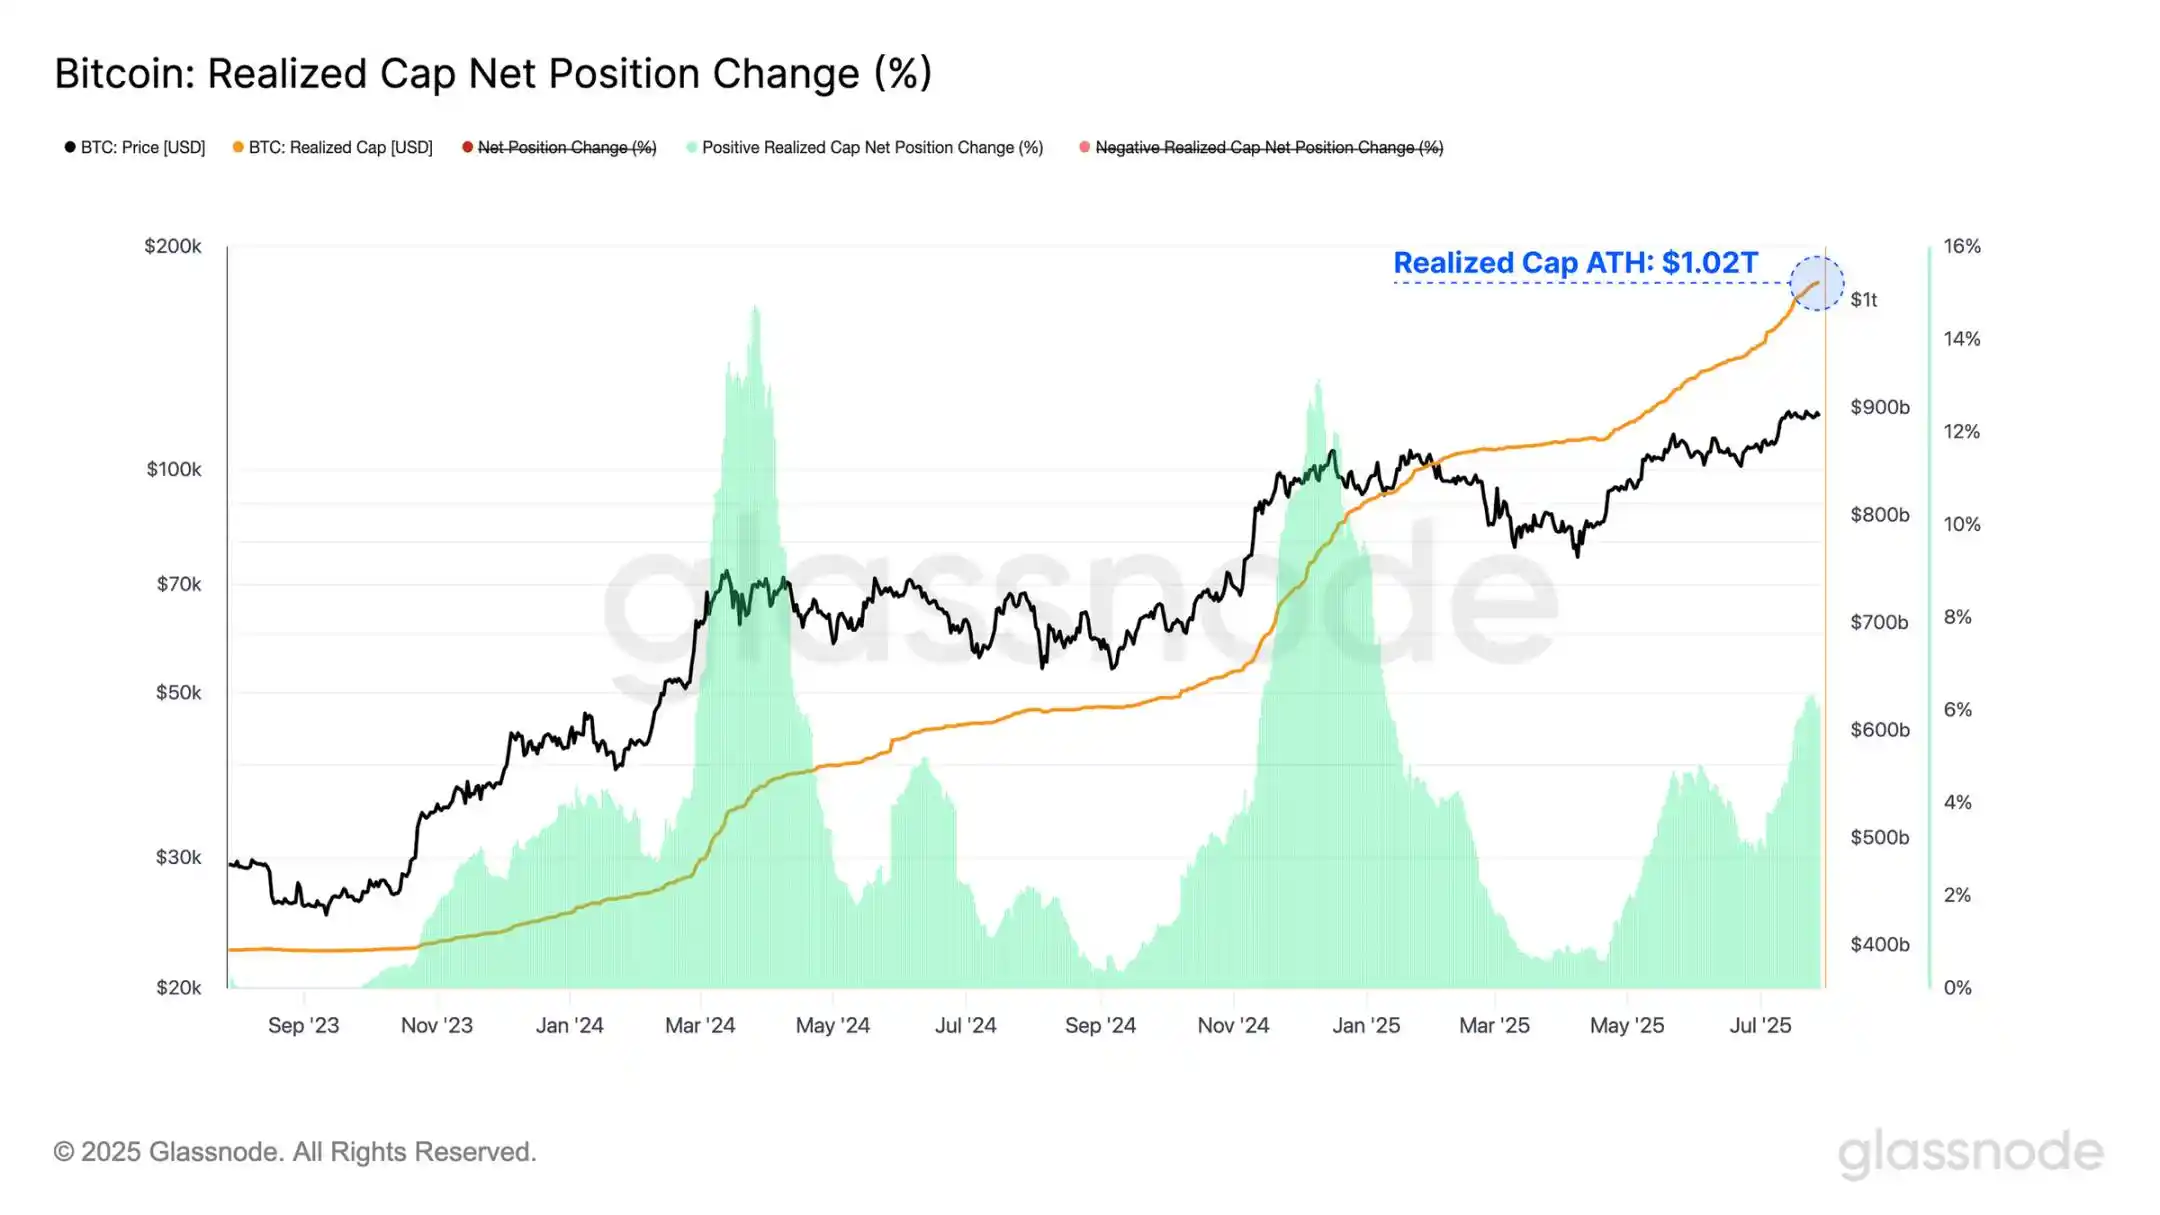
Realized Cap is a fundamental on-chain metric used to quantify the total liquidity in the Bitcoin network priced in USD. This metric has now surpassed $1.02 trillion, highlighting the increasing depth of liquidity and market thickness of this asset.
This liquidity was tested over the weekend as an early Bitcoin investor sold 80,000 BTC (approximately $9.6 billion) through Galaxy Digital's service, likely through a mix of market and OTC sales. The resulting sell pressure drove the price down to $115,000 before stabilizing at $119,000.
This event showcased Bitcoin's ability to absorb massive sell-offs, even during typically low-liquidity weekend trading hours, affirming the robustness of the market structure.
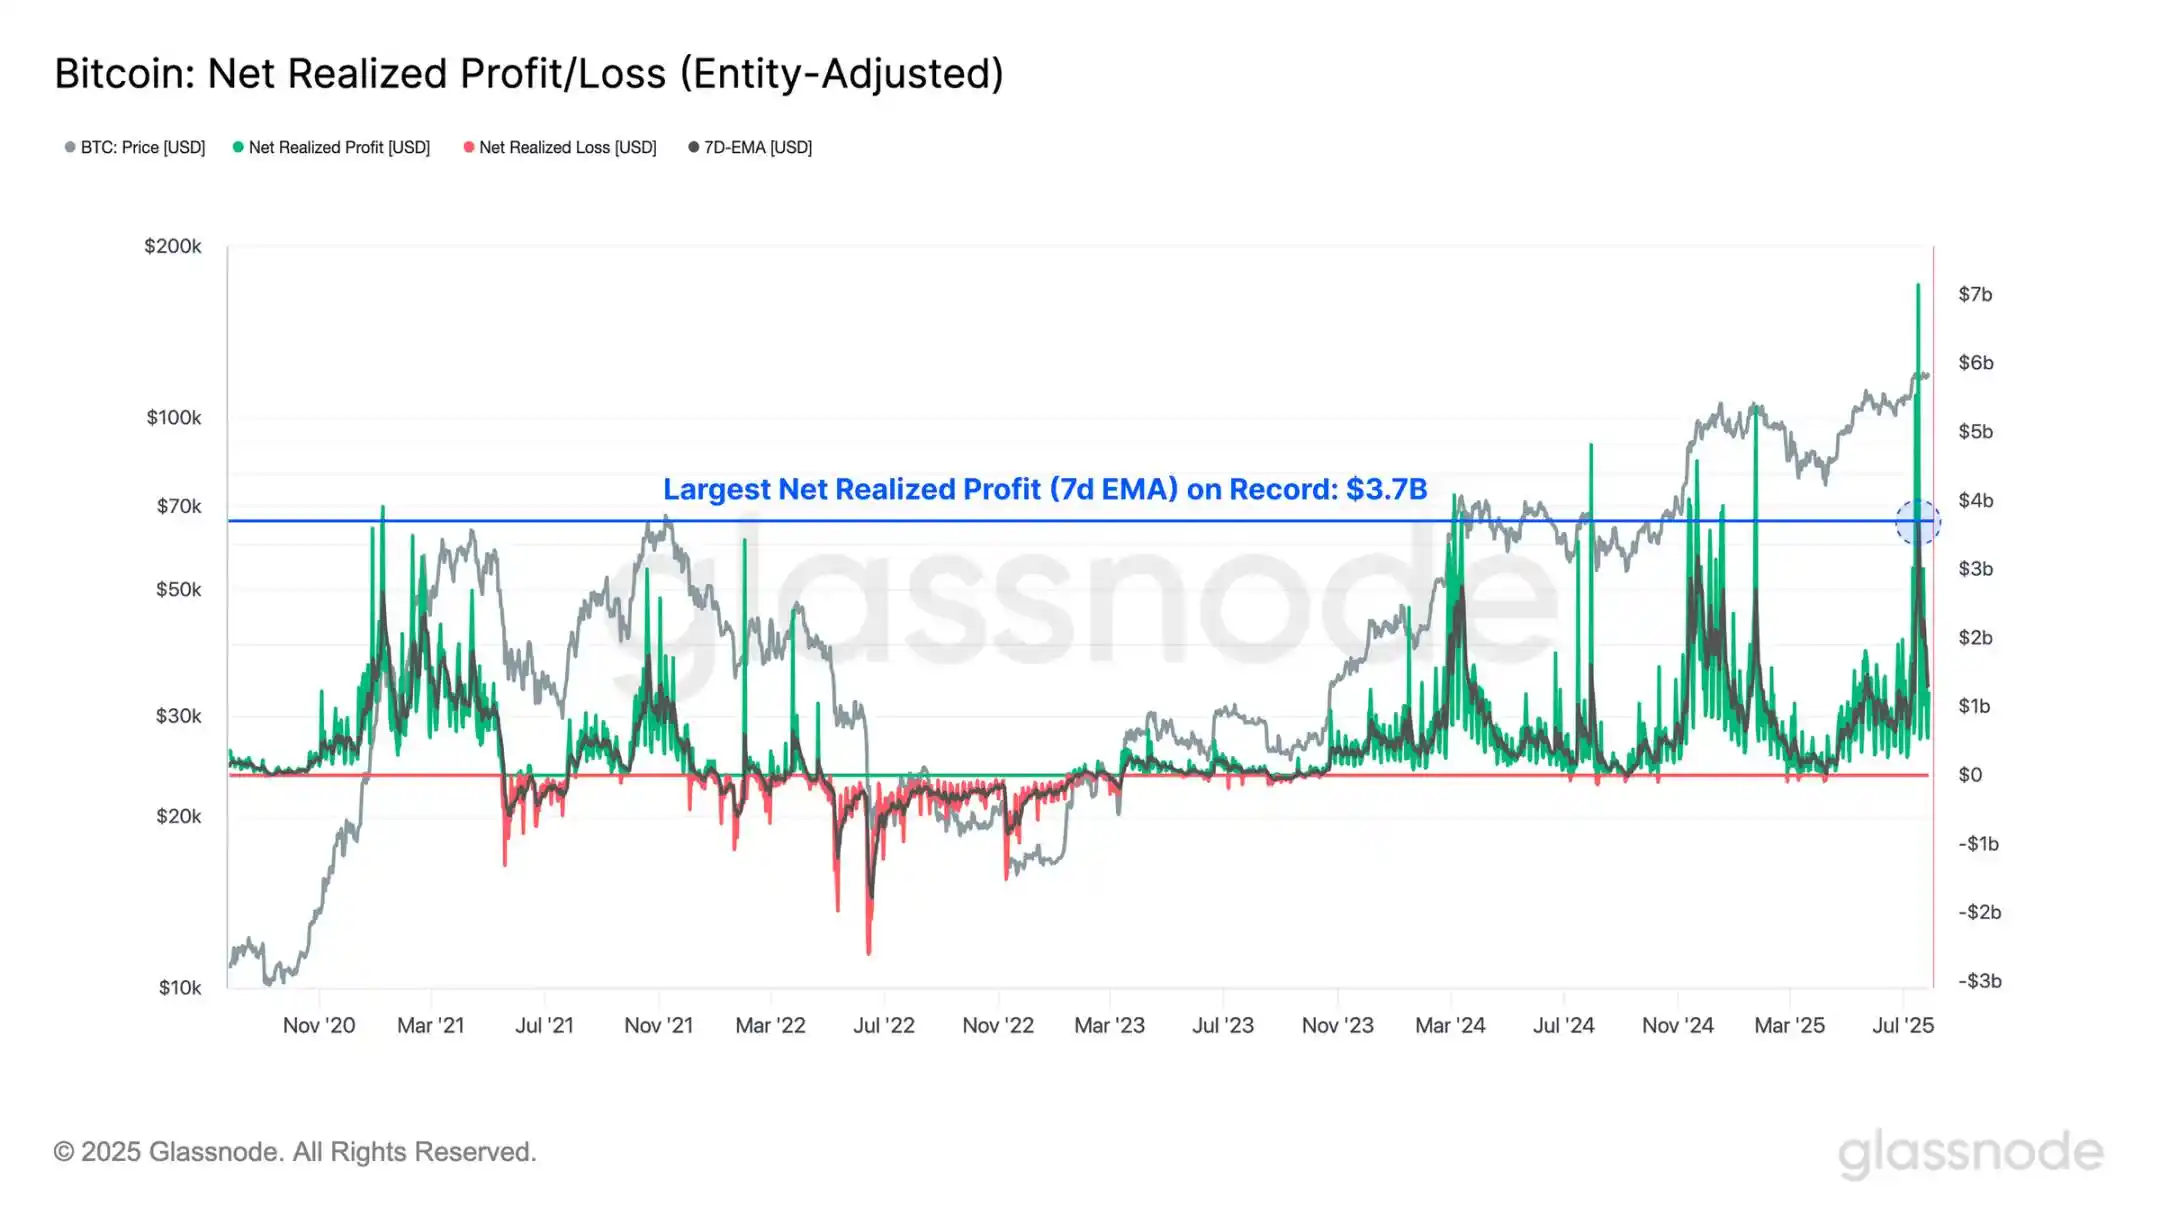
This event also drove the Net Realized Profit/Loss to a historical peak of $3.7 billion. It is worth noting that the surge in this metric preceded the weekend sell-off, reflecting funds moving ahead of final distribution.
Since the batch of tokens was initially labeled as internal transfers by entity-adjusted algorithms, subsequent address movements through Galaxy Digital were recorded as transactions with economic significance, namely ownership changes.
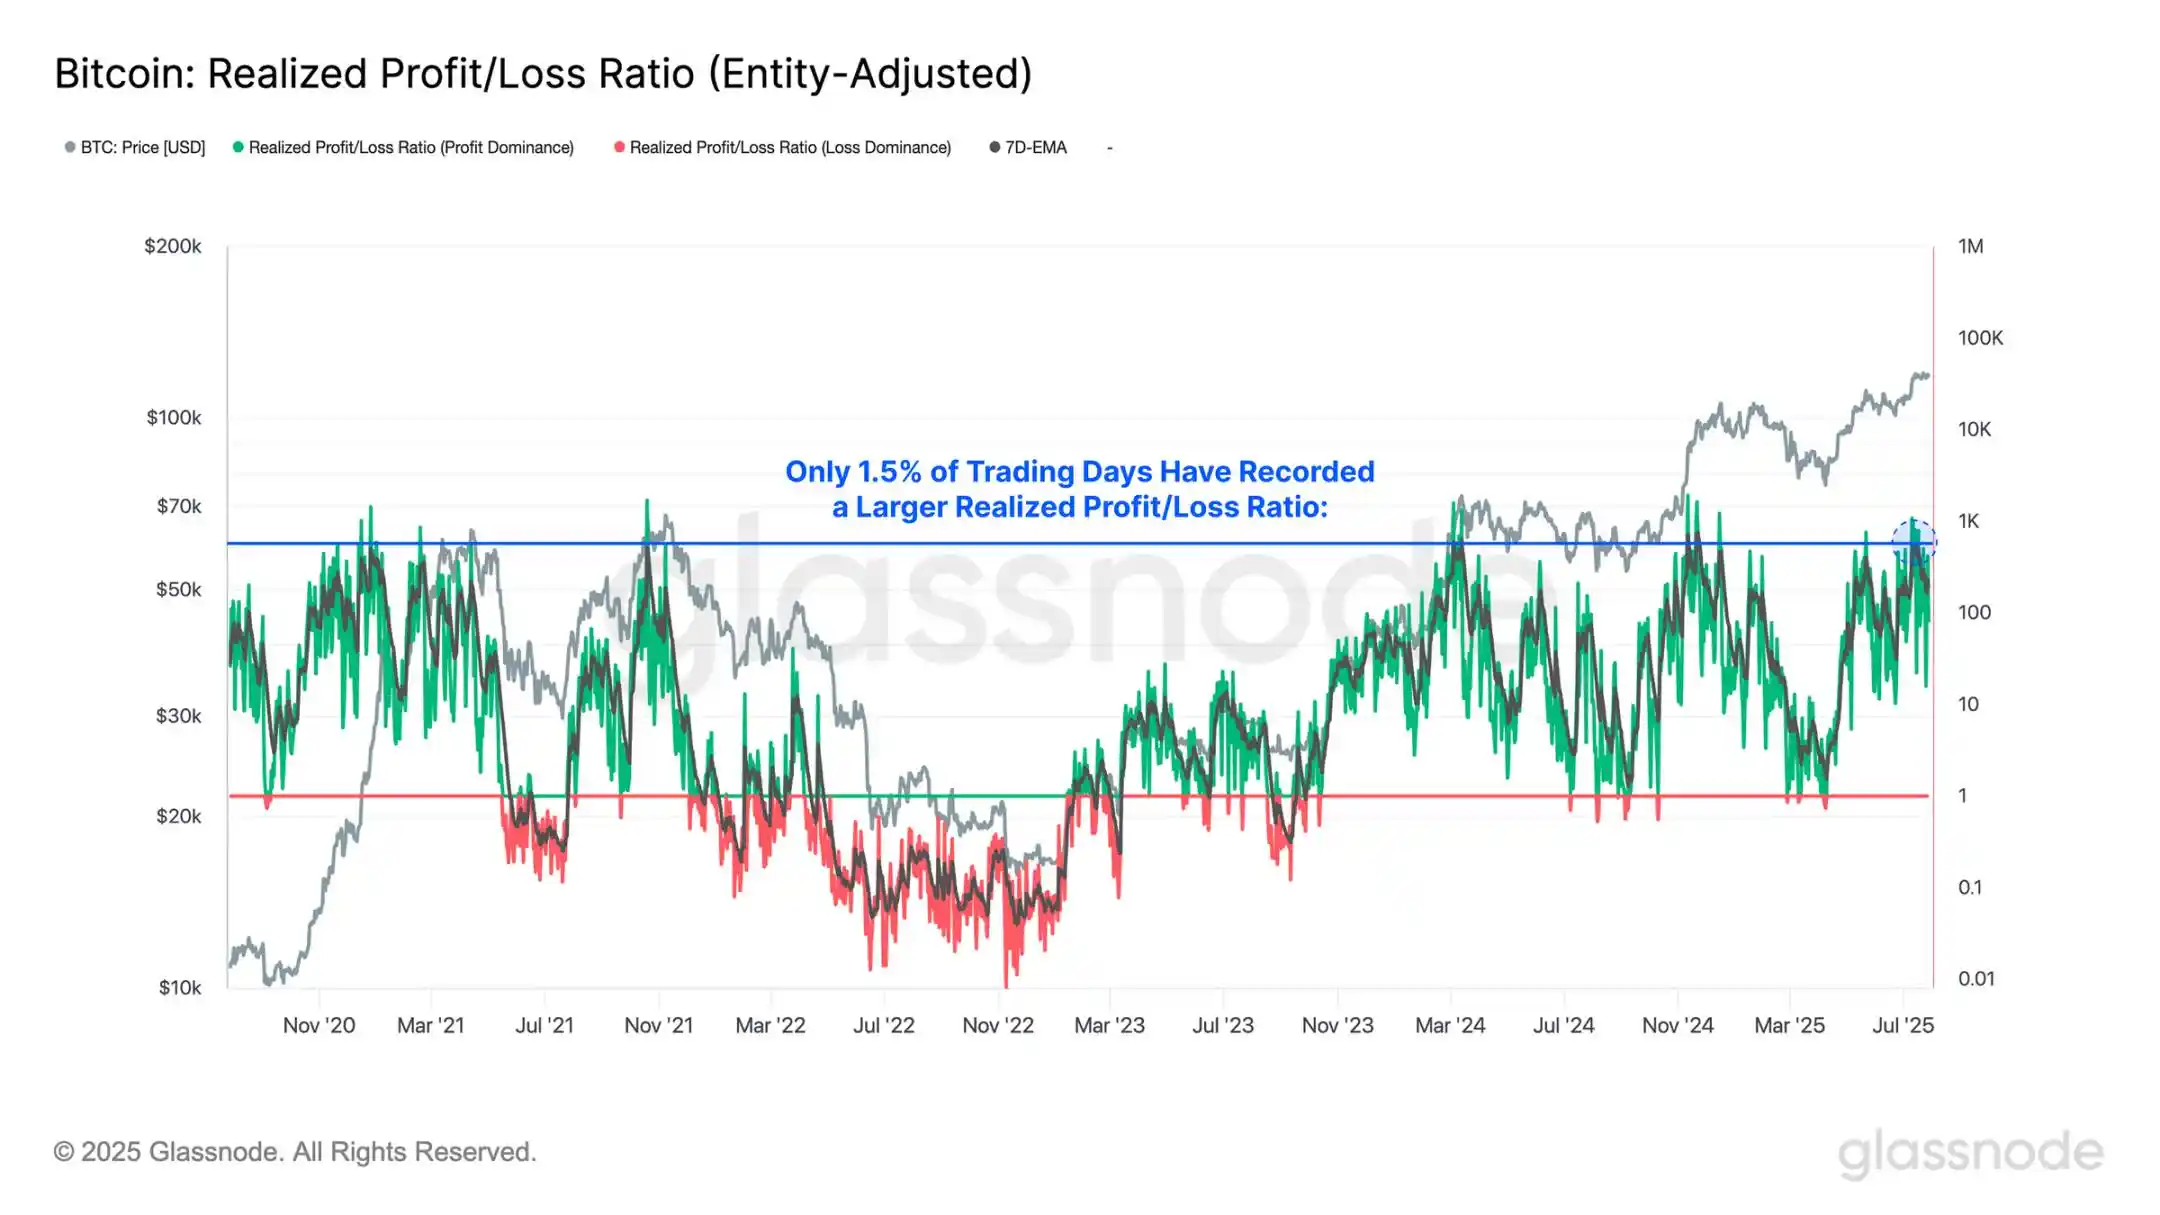
The recent surge in profit-taking behavior has rapidly accelerated the Realized Profit/Loss Ratio, with current realized profit now outweighing losses by 571 times. This value is at an extreme high, with only 1.5% of trading days in history exceeding this level.
However, interpreting this signal requires caution. While extreme profit-taking behavior may signal a price top (as seen during the $73,000 historical high in March 2024), it is not an immediate response. For example, when breaking $100,000 at the end of 2024, the peak in profit-taking occurred at $98,000, yet the market continued to rise by 10% to $107,000 before peaking.
This lagging effect suggests that significantly increased profit-taking often anticipates (but does not immediately cause) market exhaustion. It forms supply pressure that takes time to digest, and market reactions may have a lag.
Holding Duration Analysis
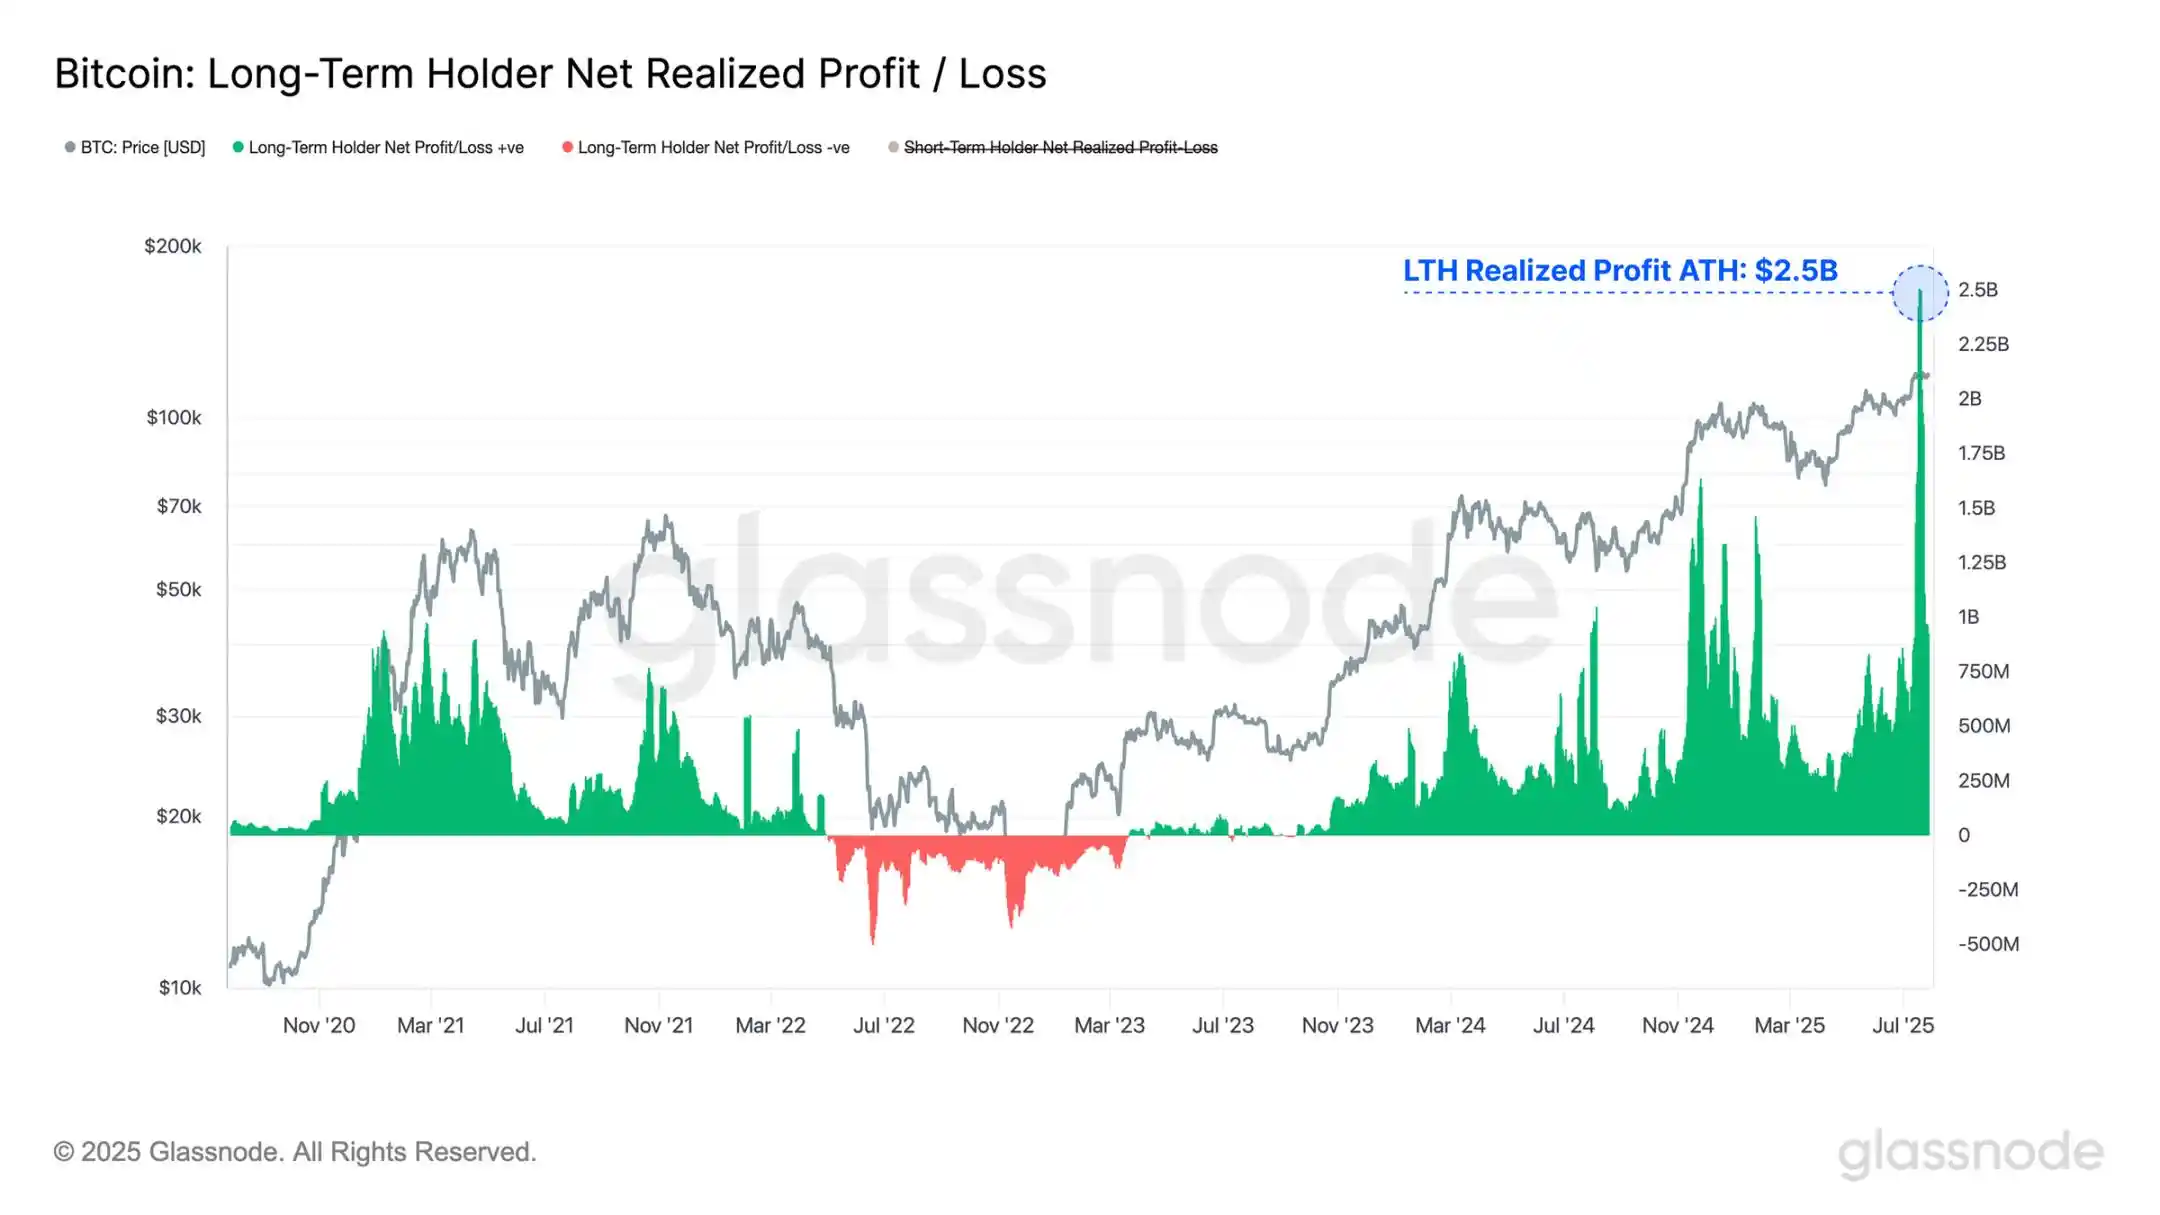
After absorbing a large number of long-dormant tokens, long-term holders' Net Realized Profit/Loss has hit a new historical high of $2.5 billion, surpassing the previous peak of $1.6 billion. This marks the largest single sell-off event in Bitcoin's history, an extreme liquidity stress test, yet the market has shown remarkable resilience, with the price remaining near its all-time high.
This further confirms Bitcoin's market exceptional ability to withstand significant distribution events, as witnessed earlier in this cycle with the Mt. Gox reimbursement and the German government's sell-off.
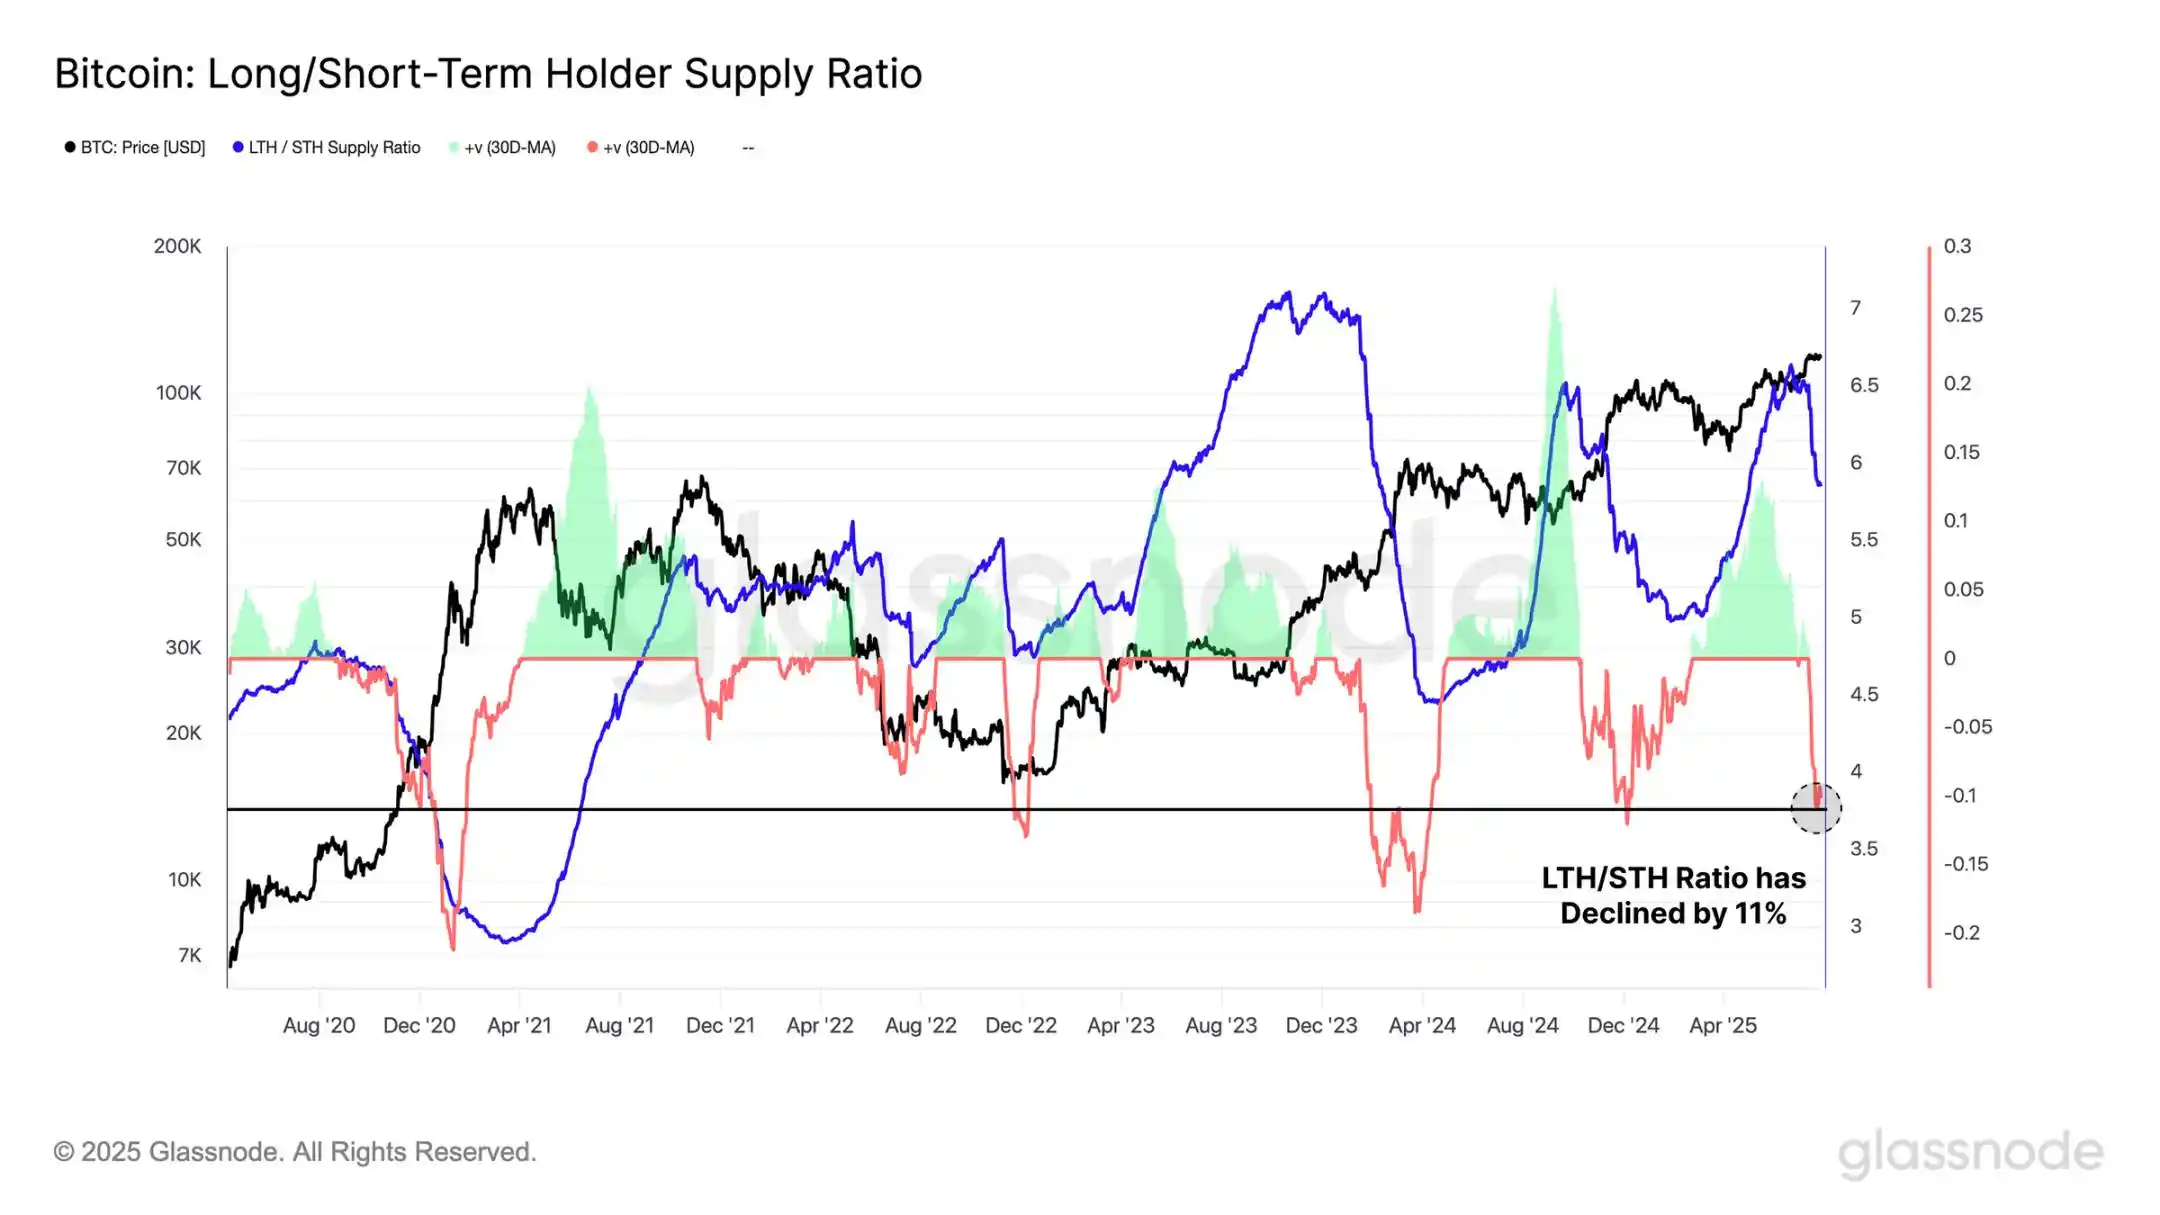
By comparing the supply ratios of long-term and short-term holders, a similar pattern can be observed in the formation of the three historical peaks in this cycle: after an initial accumulation phase, there is always a sharp shift towards aggressive distribution.
The current distribution phase is still ongoing, with the LTH/STH supply ratio continuing to contract. Over the past 30 days, this ratio has decreased by 11%, with only 8.6% of trading days experiencing more significant declines, highlighting the intensity of investor behavior shift.
Unrealized Profit Analysis
Despite facing significant selling pressure last weekend, including large-scale profit-taking by long-term investors, the Bitcoin market has remained unusually stable. As a result, the vast majority of participants still hold substantial unrealized profits, with 97% of the circulating supply currently holding a cost basis below the spot price.
The total amount of paper profits held by market participants (i.e., unrealized profits) recently hit a historical peak of $1.4 trillion. This indicates that most investors are sitting on massive unrealized gains, which, if the price continues to rise, could trigger potential future selling pressure.
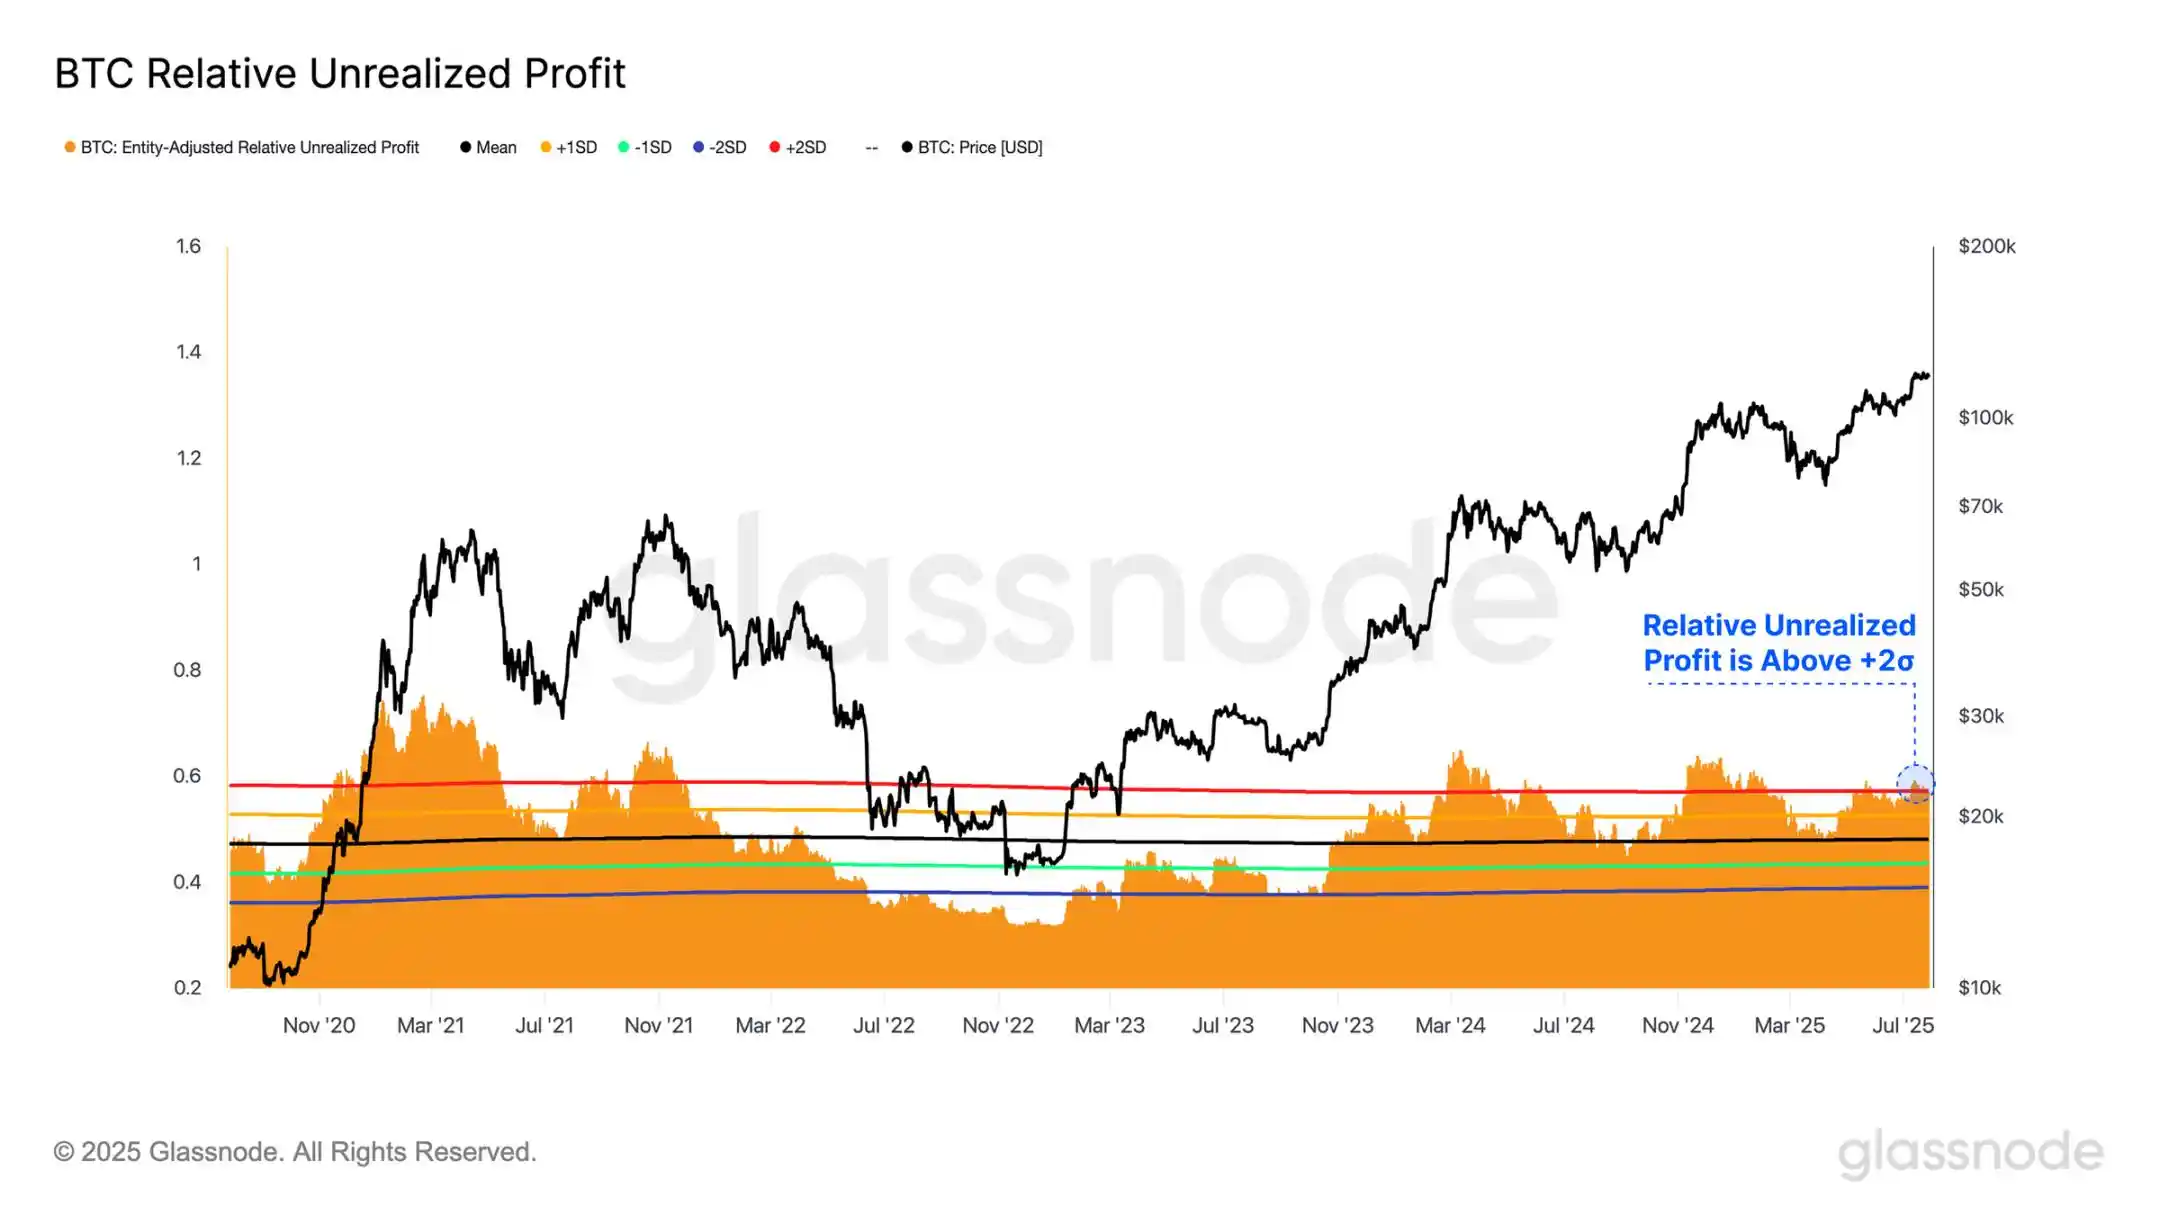
We can also observe the unrealized profit market value ratio as a standardized metric. Currently, this metric has once again broken through the +2σ range, a level that has historically coincided with market euphoria periods and historical tops. This standardized view once again confirms the reality of participants holding significant unrealized profits.
This indicates that many investors hold an optimistic view of the market conditions, which is both a sentiment booster and implies that the motivation for subsequent profit-taking may strengthen.
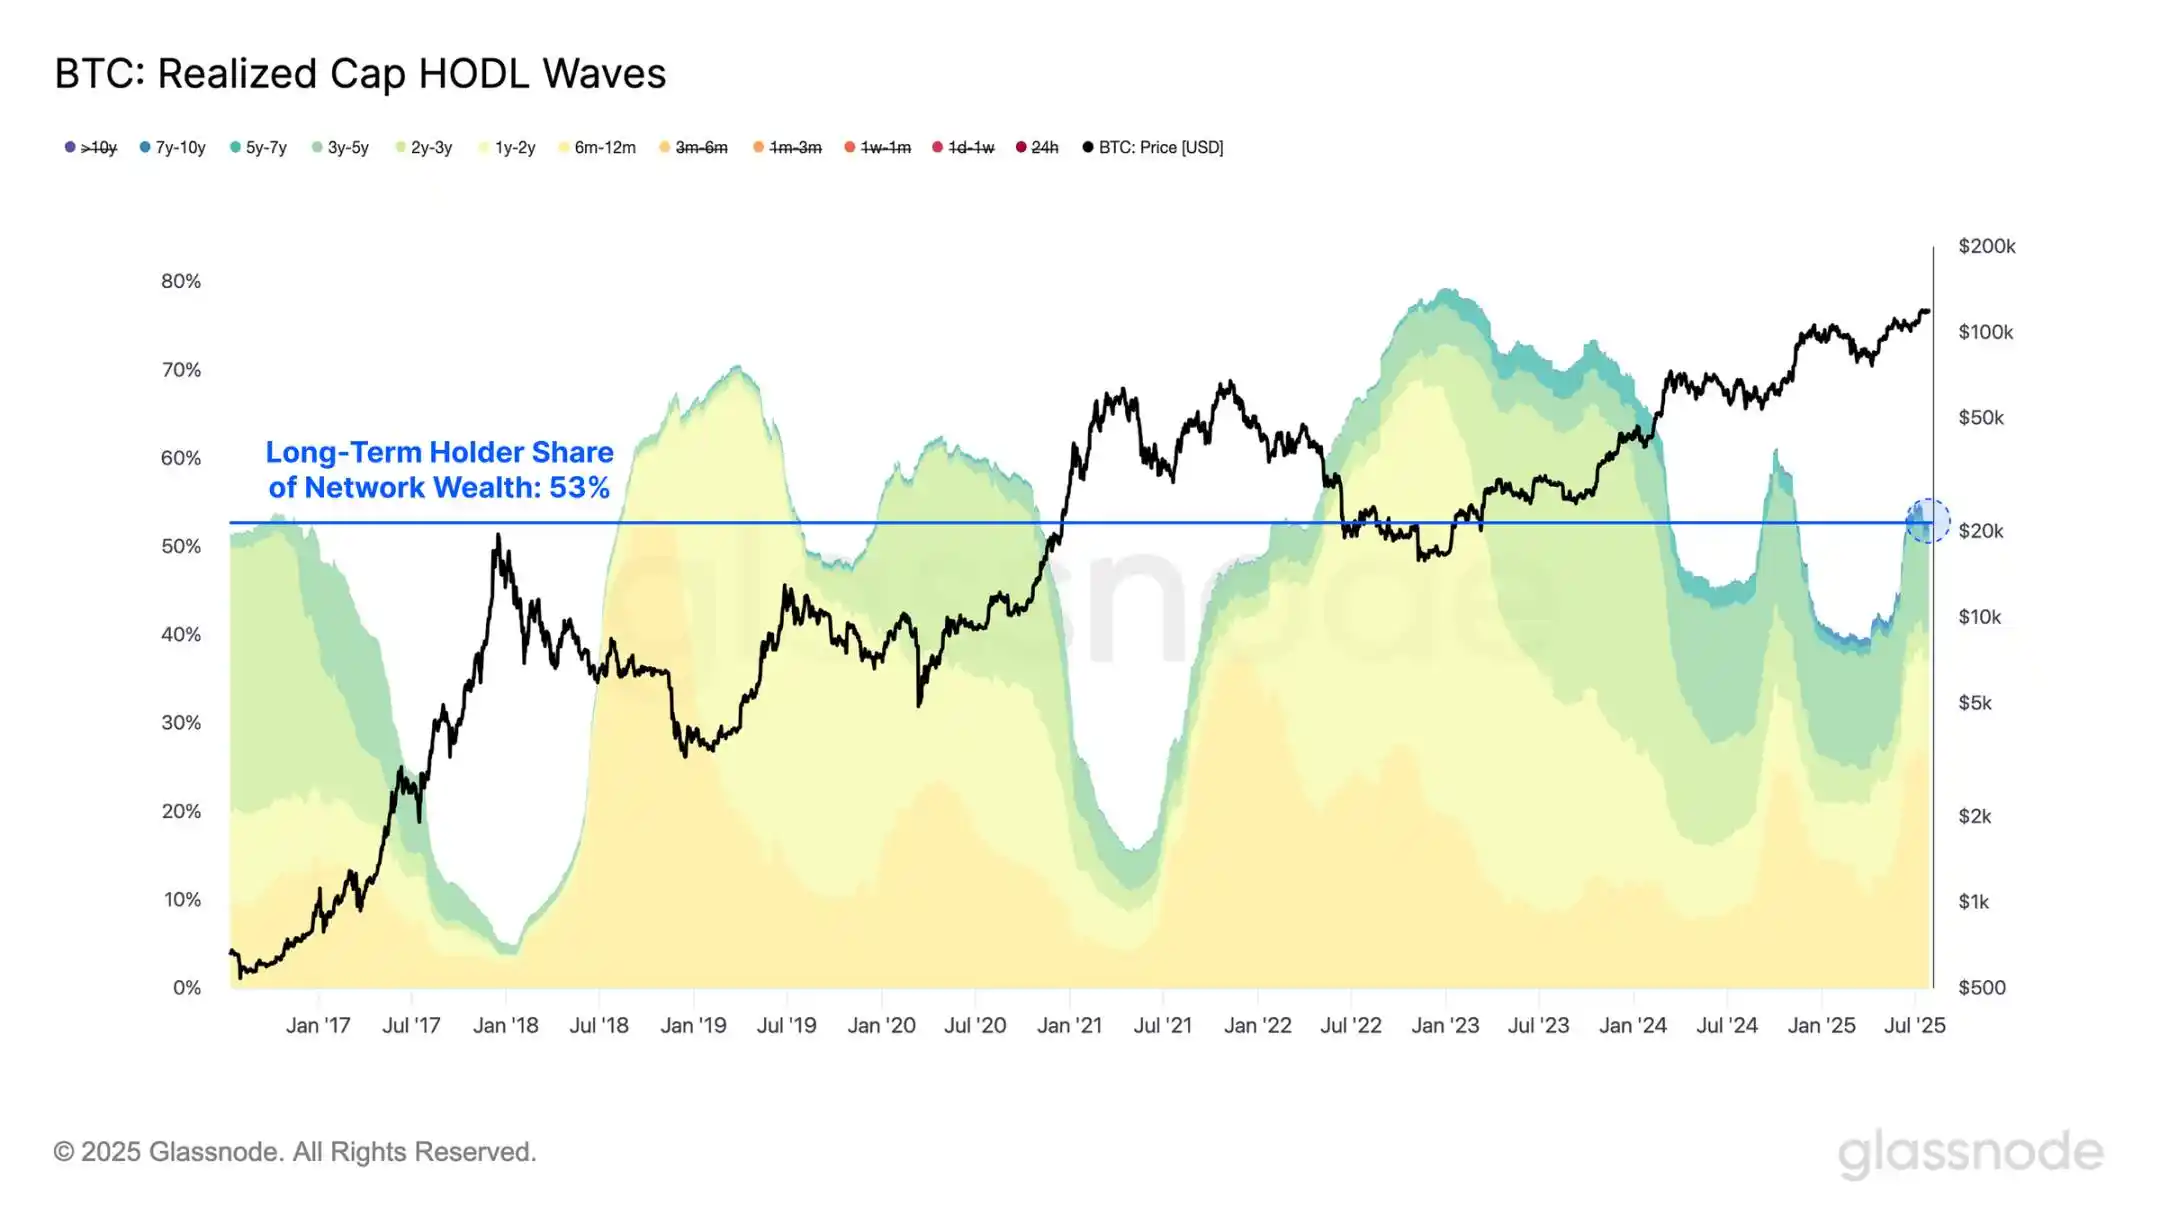
Unlike previous cycles, long-term holders still control 53% of the wealth. Although this group continues to distribute in this cycle, the proportion remains significant in an environment where unrealized profit is already at a high level.
The overall dynamics suggest that long-term holders may still have further selling pressure. As the price rises to a level enticing enough to activate deep-sleeping whale tokens, the market needs more demand influx to absorb the selling pressure.
Market Cost Analysis
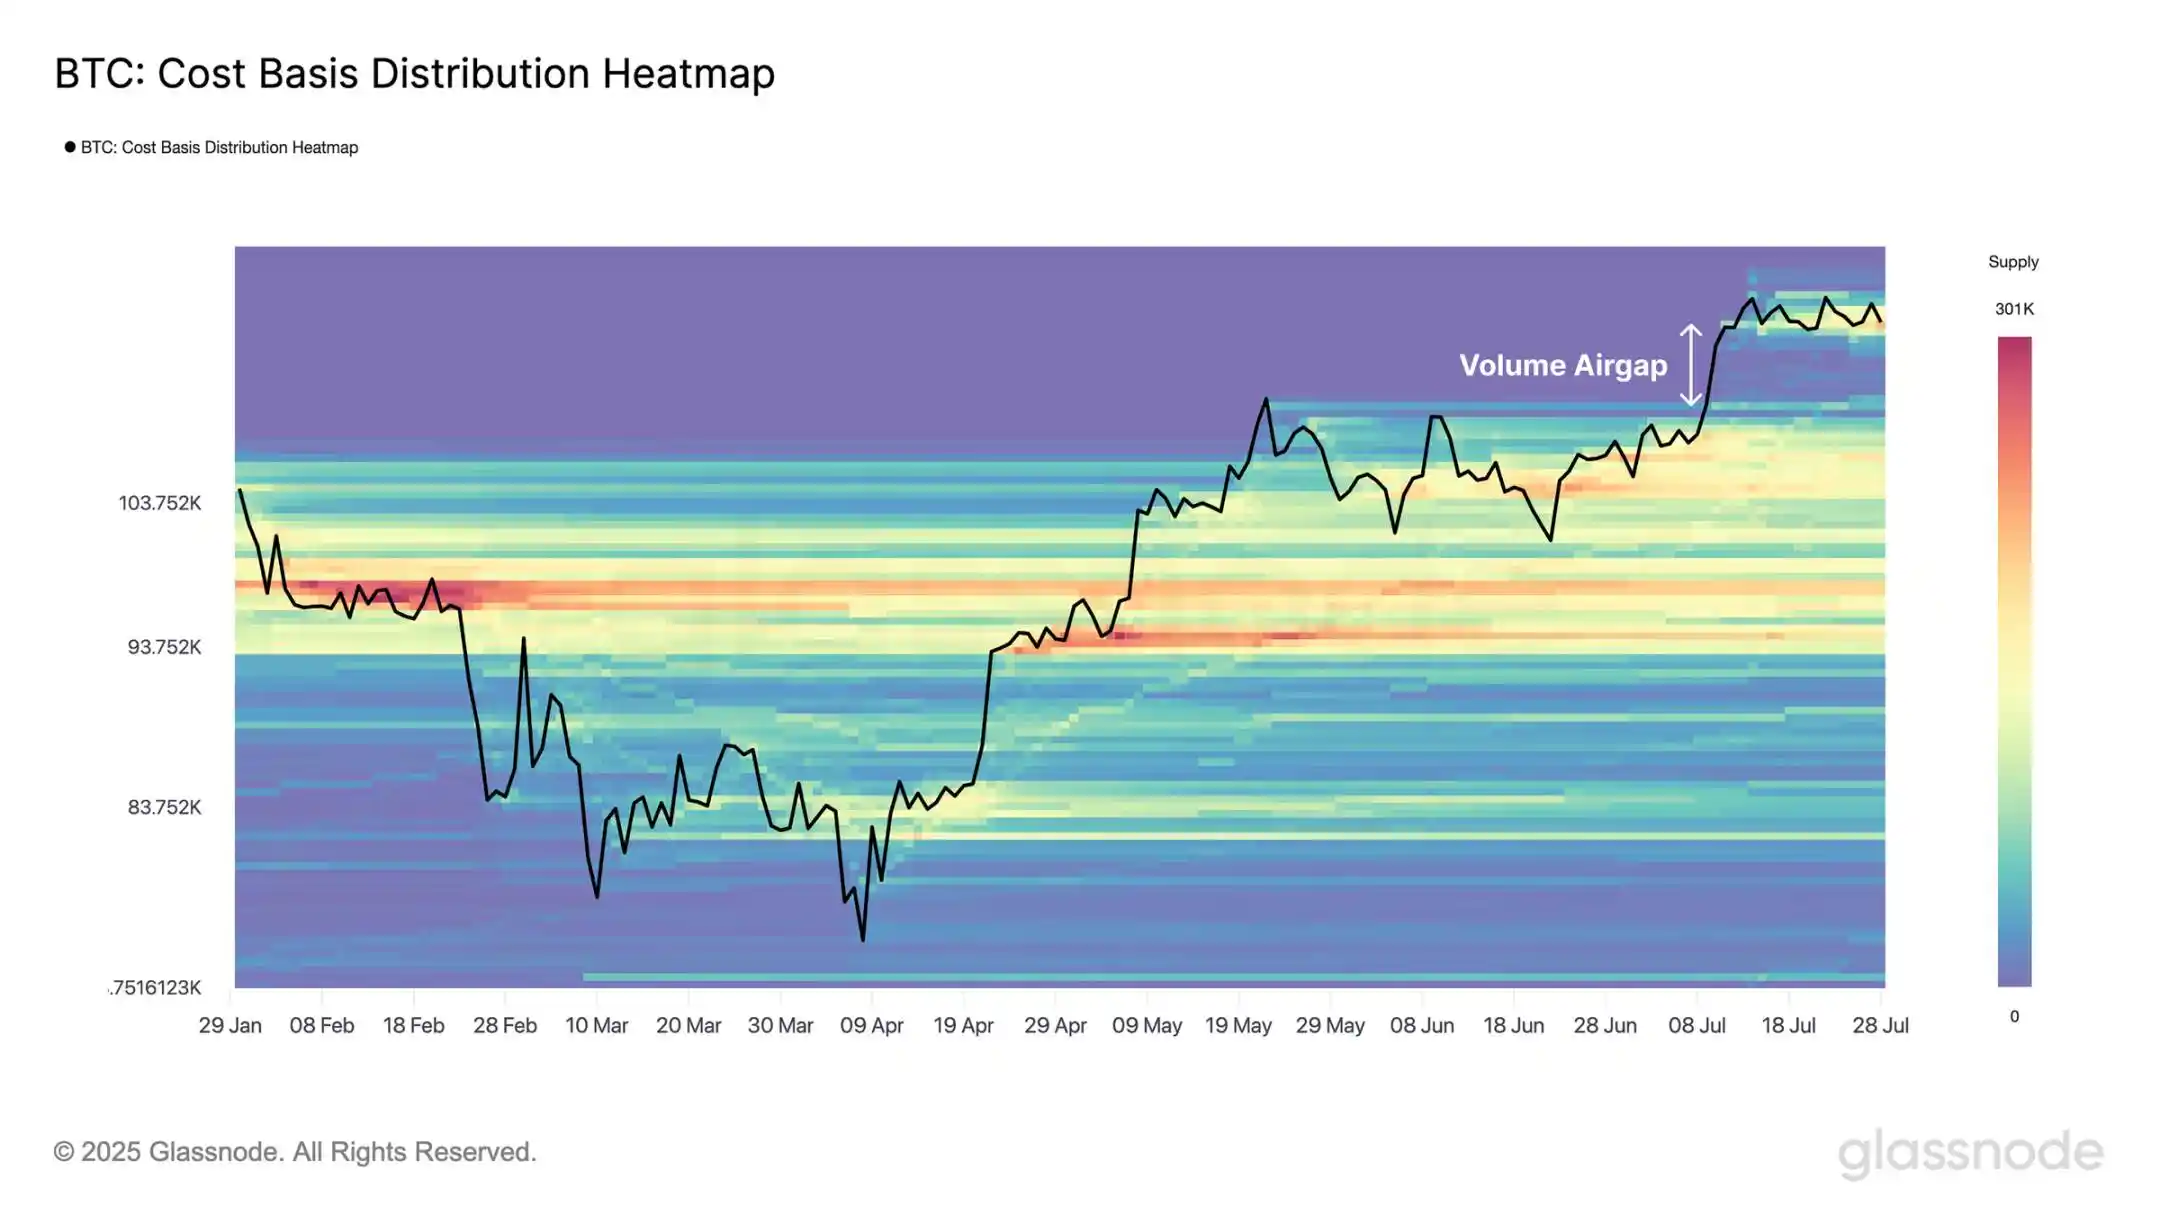
Looking at the Bitcoin cost basis distribution chart, a significant cost basis accumulation is visible in the $11.7K-$12.2K range. This indicates that many investors accumulated in this high-price range.
Notably, there is a volume profile gap below the spot price in the $11K-$11.5K range, a result of insufficient turnover during the rapid price ascent. Not all volume gaps need to be filled, but this area has price gravity, making it a key area of focus for testing the effectiveness of support during a potential pullback.
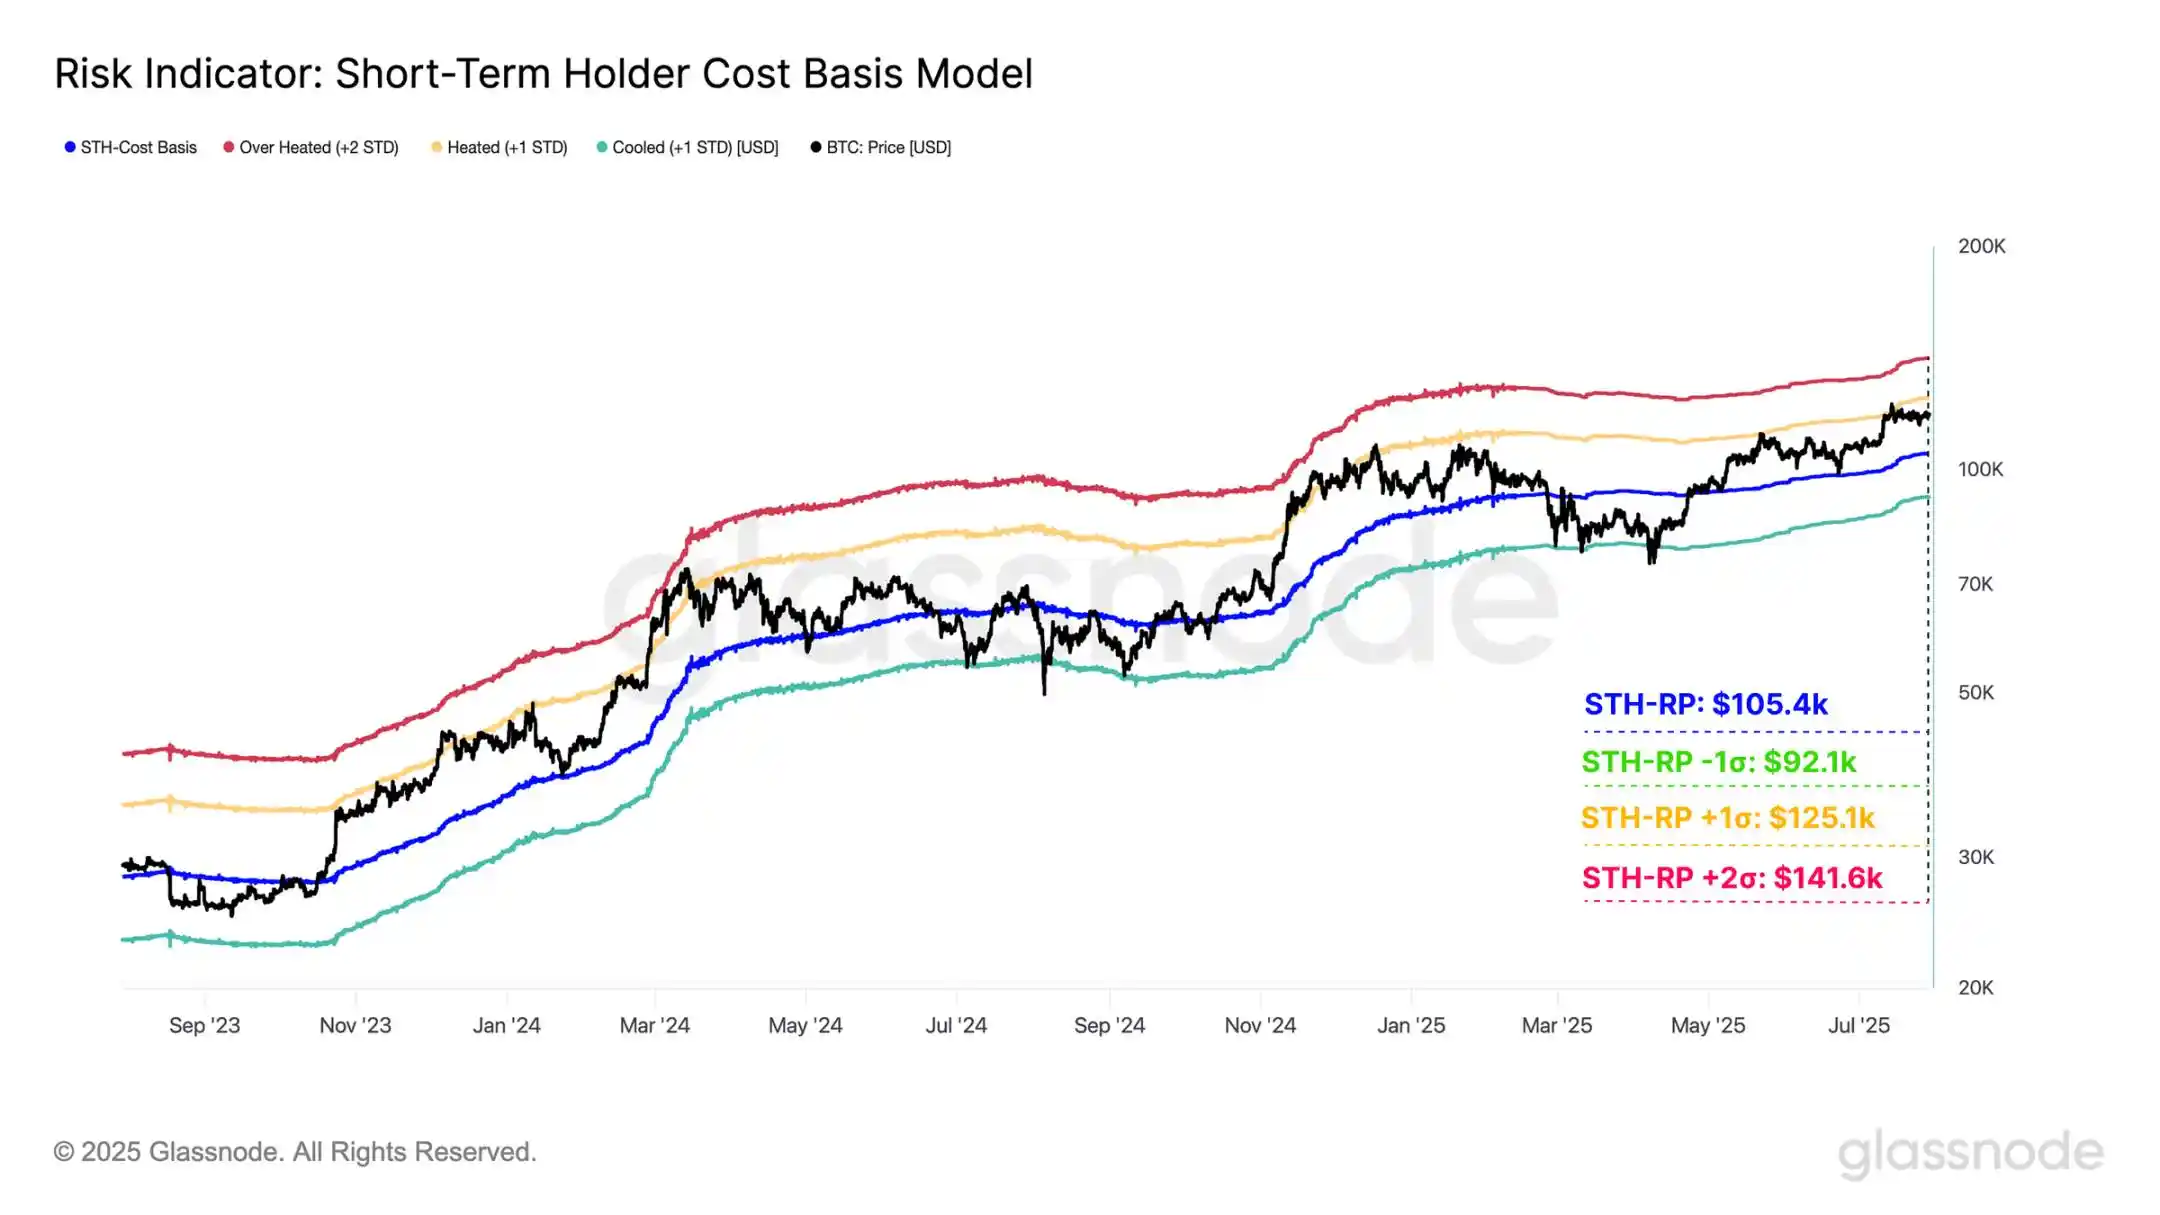
Short-Term Holder Cost Basis (representing the average holding cost of new incoming investors) has always been a key threshold to delineate market conditions during partial bull-bear cycles. Adding standard deviation intervals can increase the statistical dimension:
· STH CB +2σ: $14.16K
· STH CB +1σ: $12.51K
· STH Cost Basis: $10.54K
· STH CB -1σ: $9.21K
The key observation is that the Bitcoin price has consistently remained above the short-term holder cost basis, which is a positive signal of market strength. Additionally, in all major top structures of this cycle, the price has encountered resistance in the +1σ range, and the current pattern is no exception.
From a macro perspective, Bitcoin may sustain a range of $10.5K to $12.5K in consolidation before a decisive breakout. Upon a successful breakout, the $14.1K region (corresponding to the +2σ range) could become the next strong resistance level, where on-chain indicators suggest a potential sharp increase in selling pressure.
By analyzing the cost basis of subgroups within short-term holders, a "fast-slow cost basis band" can be constructed as a momentum indicator of short-term market sentiment. The current price remains above the cost basis of all short-term subgroups, indicating market strength. It is worth noting that the cost basis bands of holders from 24 hours to 3 months (at $11K-$11.7K) highly overlap with the low-volume area in the cost basis distribution chart.
The resonance of multiple independent indicators reinforces the significance of this price region, implying it may act as a key support during pullbacks.
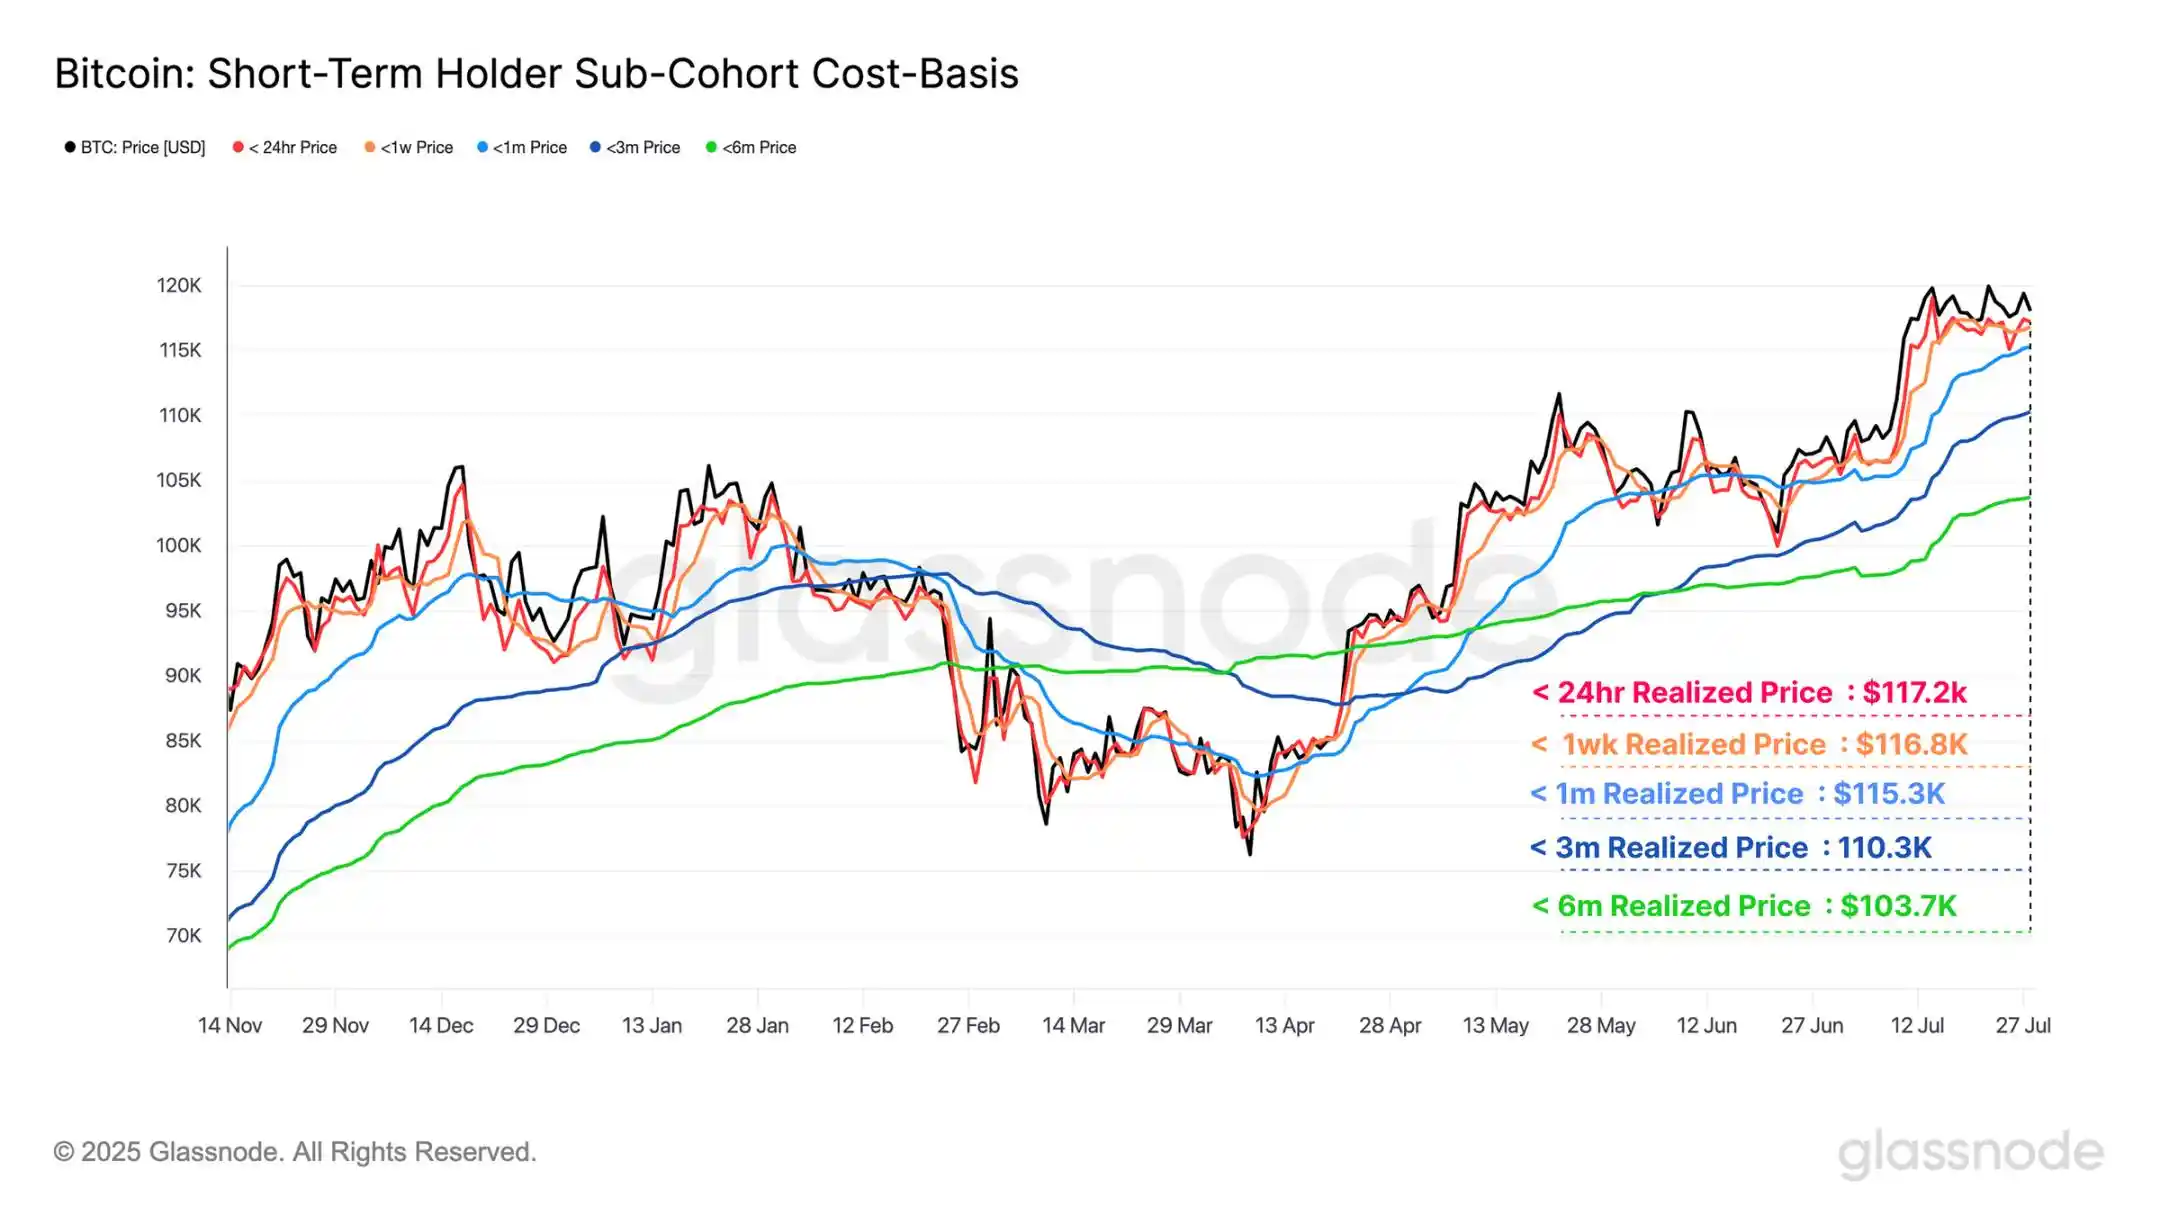
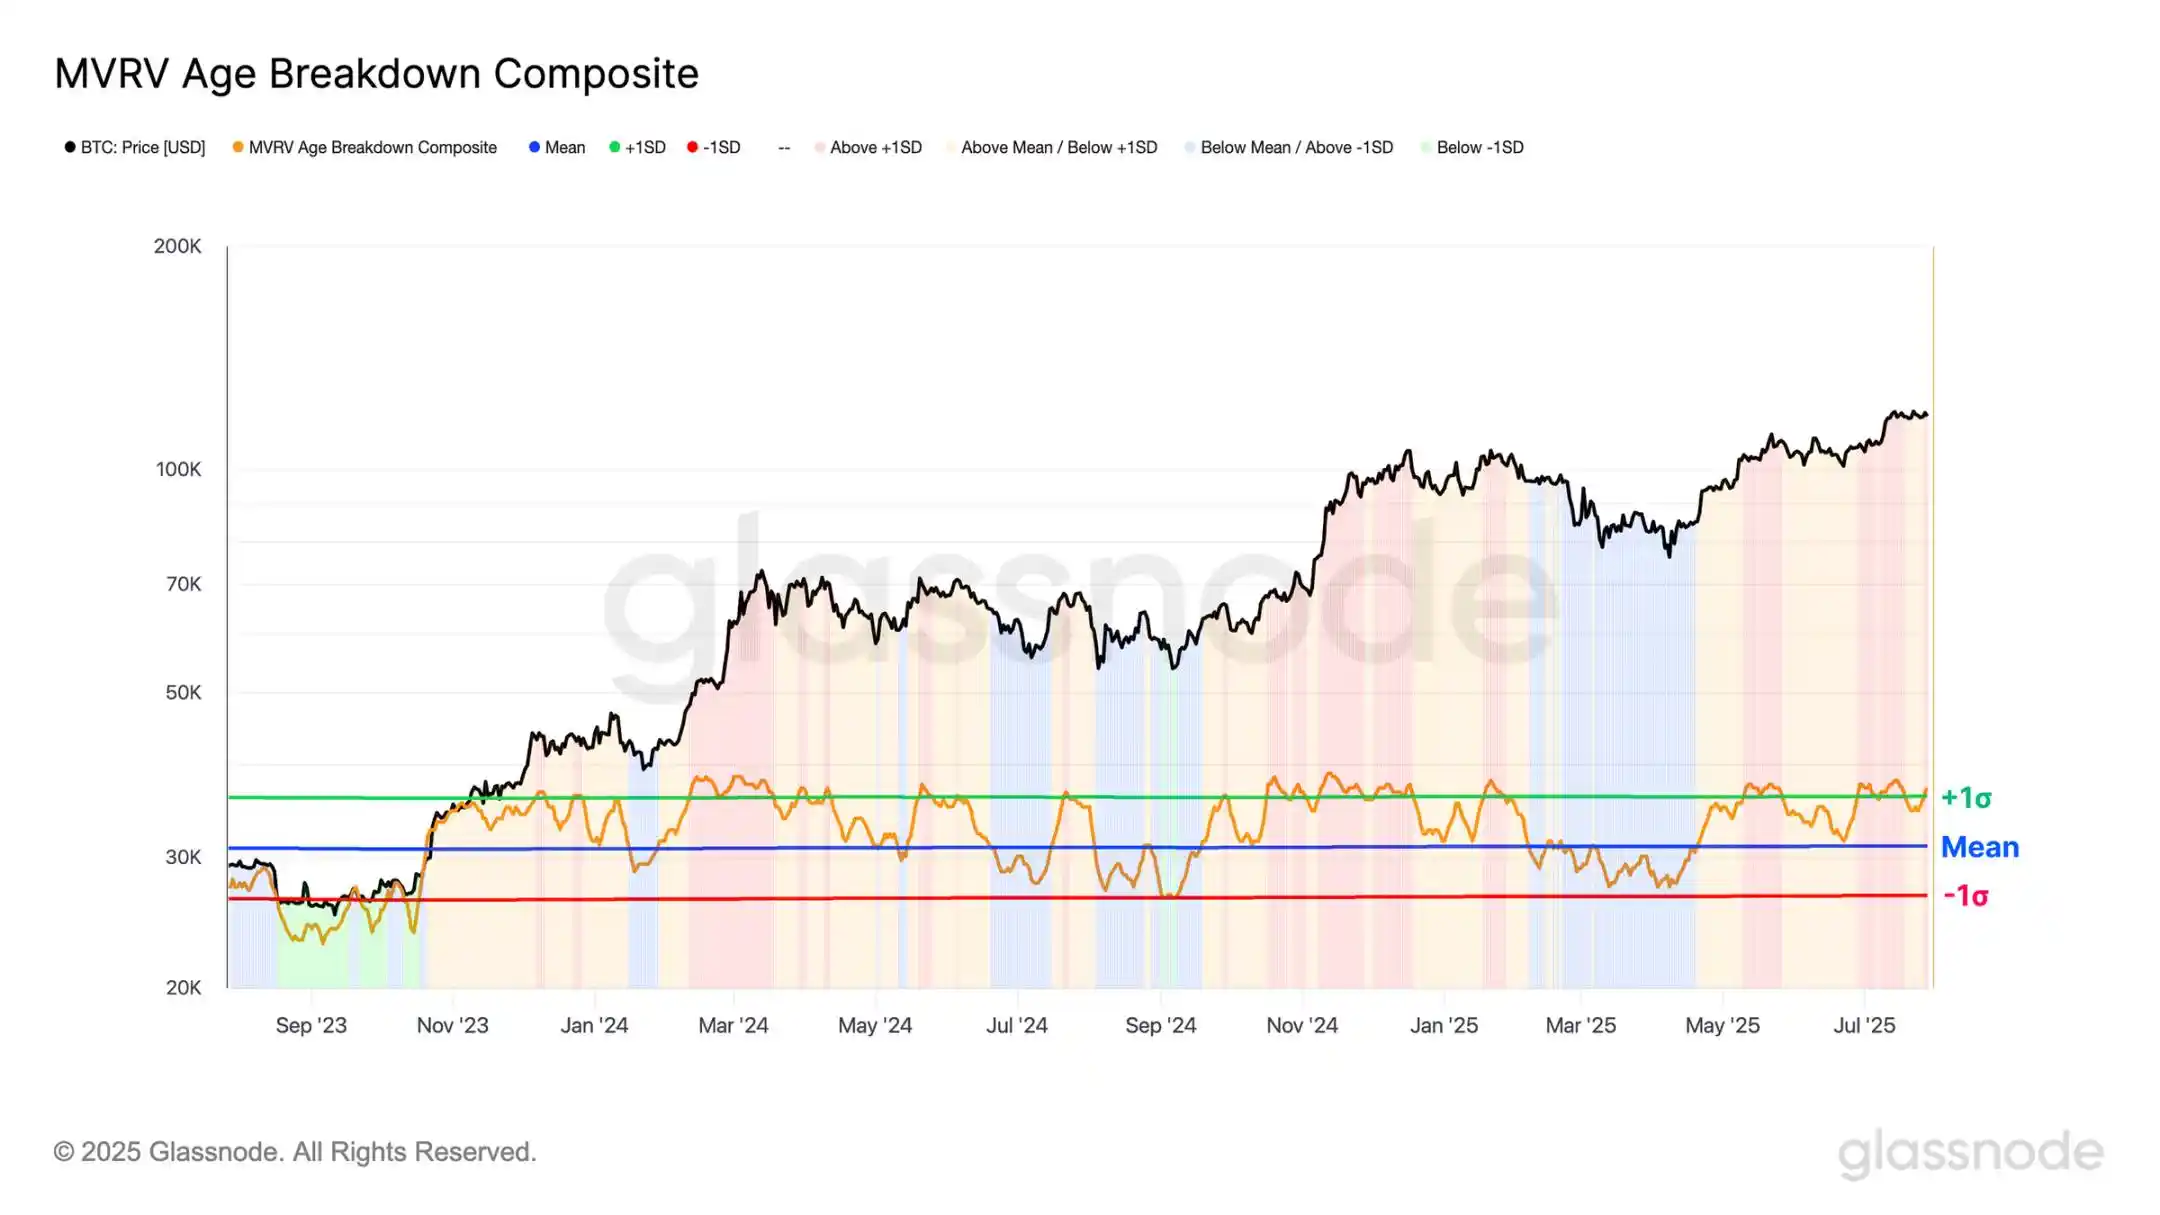
To further observe subgroup momentum, we use an equally-weighted composite index to measure the proportion of profitable subgroups. This index has remained consistently above the mean and is approaching the +1σ level over the long term, indicating robust market momentum and that the majority of new investors are still in a profitable state.
Summary and Conclusion
Bitcoin's resilience was severely tested over the past weekend as the market efficiently absorbed the sale of 80,000 BTC (worth $9.6 billion), making it one of the largest profit-taking events in its history. Despite the staggering transaction volume, the price quickly stabilized near its all-time high, demonstrating the depth and maturity of the current market liquidity.
Currently, Bitcoin is holding in the $10.5K-$12.5K range. A successful breakout of this range could alter the market landscape, making $14.1K the next focal point, where on-chain indicators suggest significant profit-taking may occur. Conversely, the low-volume area below the current price of $11K-$11.5K is worth watching closely, as this region would be a key level to monitor in case of a pullback.
Disclaimer: The content of this article solely reflects the author's opinion and does not represent the platform in any capacity. This article is not intended to serve as a reference for making investment decisions.
You may also like
SEC approves in-kind redemptions for spot Bitcoin and Ethereum ETFs

Metaplanet to Raise $3.7B for Bitcoin Purchases in Treasury Plan

SEC Launches ‘Project Crypto’ to Modernize Asset Regulation
Michael Saylor’s Bitcoin Forecasting Sparks Debate