What to Expect from Hedera (HBAR) Price in August 2025

HBAR price rallied hard in July, fueled by whale buying and strong OBV momentum. But with a descending triangle on the weekly chart and August’s weak history, the next few weeks could test support levels before any sustained rally.
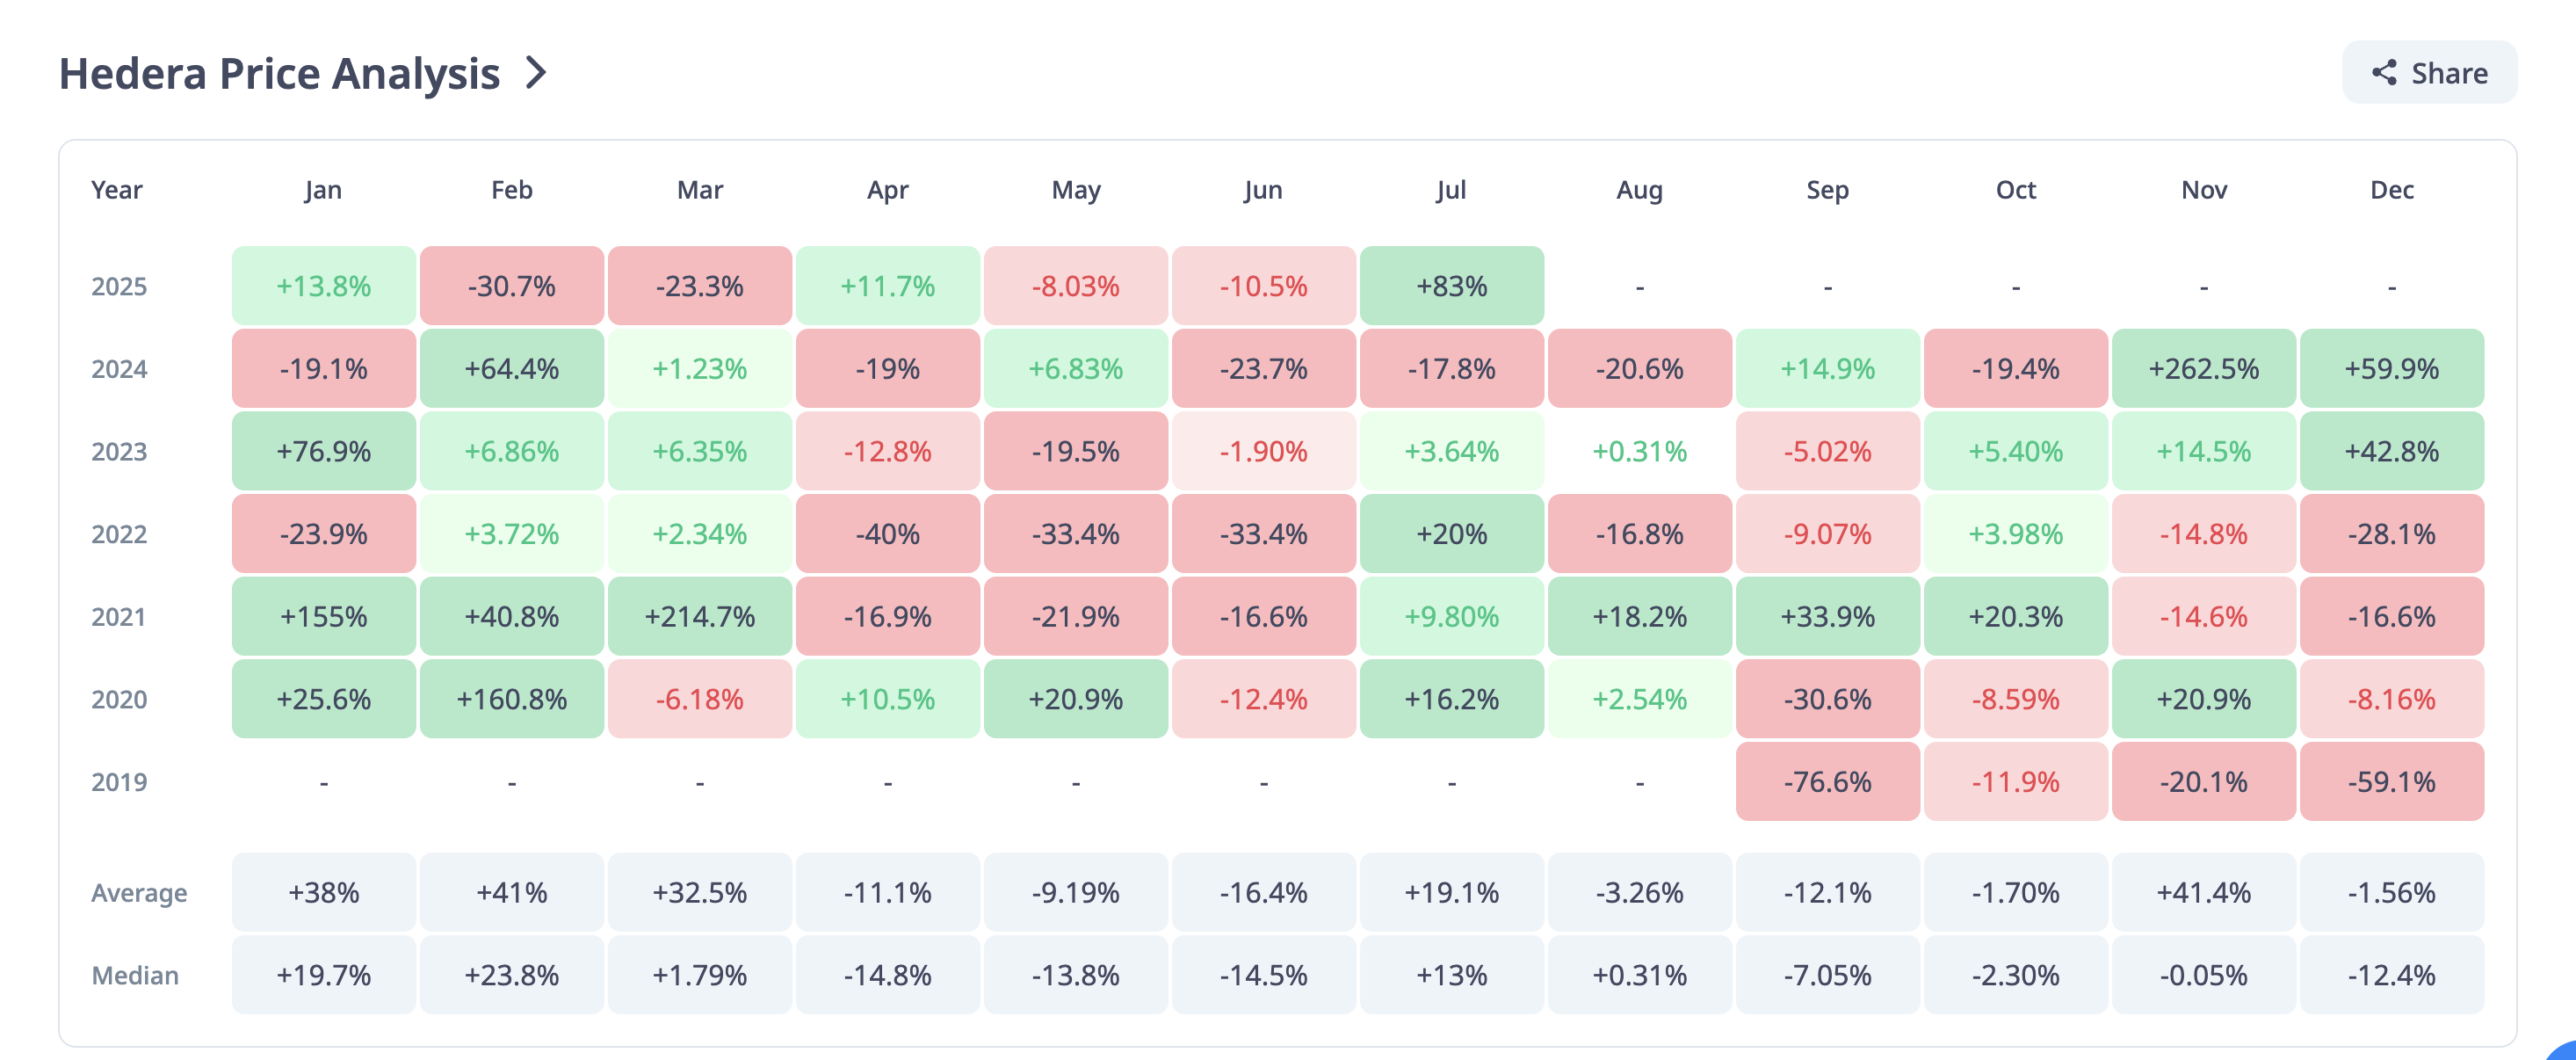
Hedera (HBAR) just closed July with 85% gains, marking its strongest monthly performance of the year. However, August has not historically been kind to HBAR.
Over the past five years, the token’s average August return is -3.26%, with a median of just 0.31%, making it one of the weaker months for the asset. The question is whether this August can break the trend or if history repeats itself.
August History Hints At A Shaky Month
Looking back at the monthly returns chart, August has only delivered a strong green close once in 2021, while most other years ended flat or negative.
 HBAR price performance:
CryptoRank
HBAR price performance:
CryptoRank
That backdrop sets a cautious tone for traders heading into this month. Even after July’s surge, history suggests the HBAR price rally could cool, especially if profit-taking kicks in.
Hedera Whales Keep Buying, But Upside Is Getting Crowded
On-chain data shows large holders with 1 million+ HBAR tokens increased their share from 64% to 77% in July, while 10 million+ token whales reached 96% of the total supply.
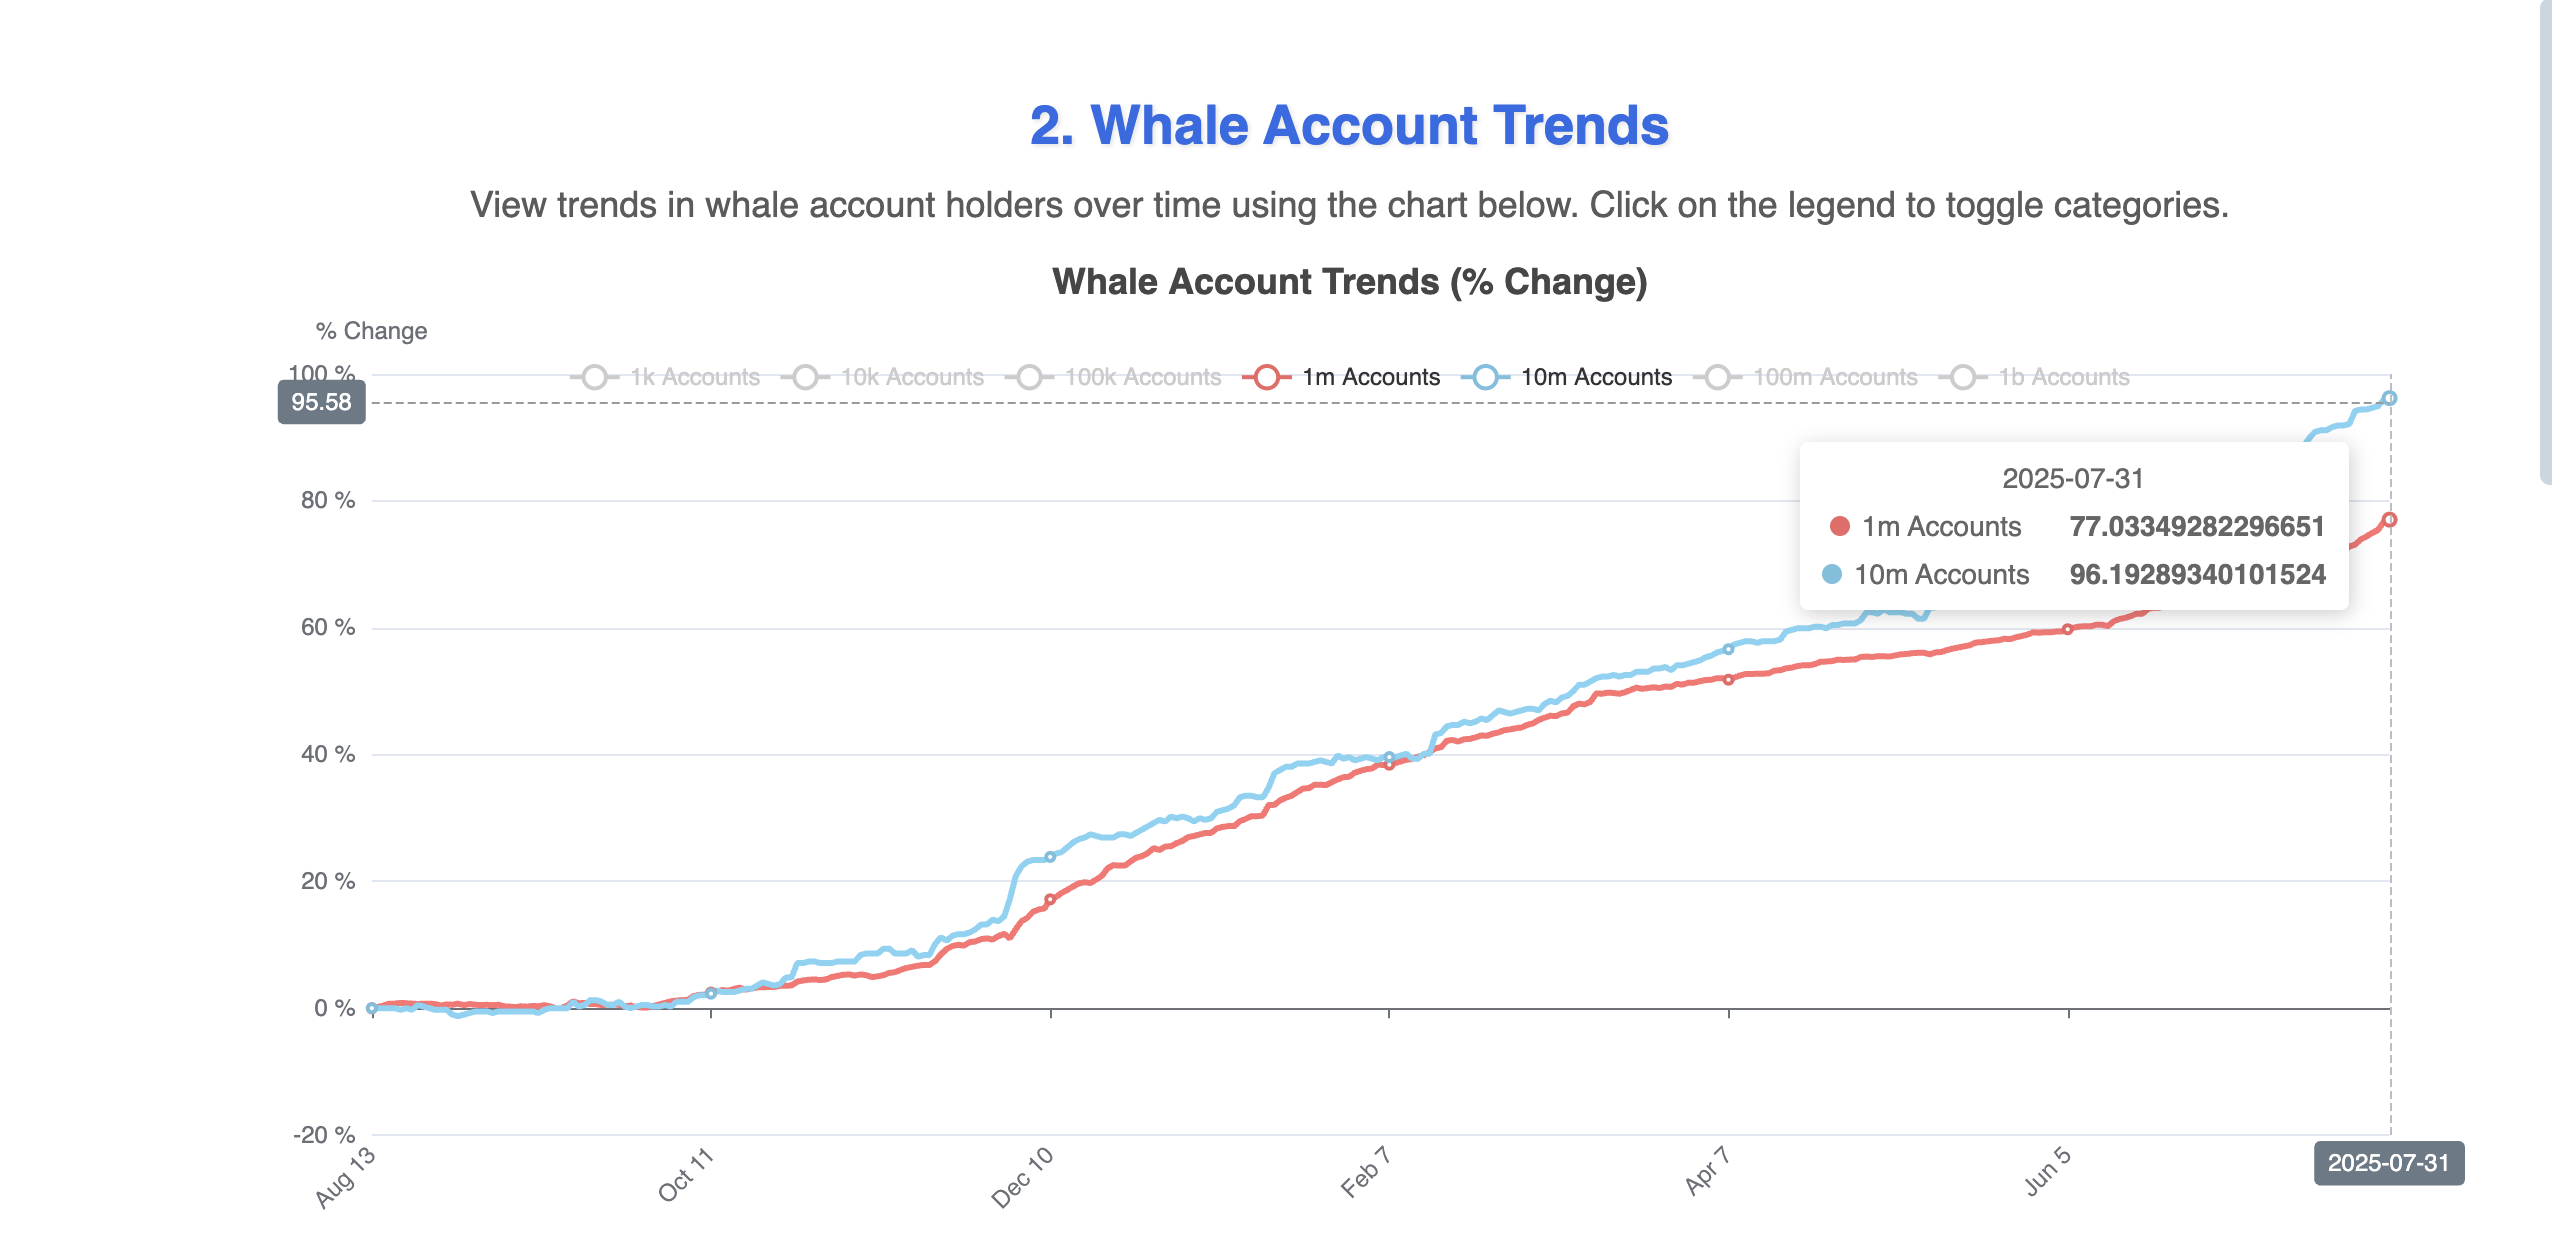 Whale action helped with the HBAR rally in July:
Hedera Watch
Whale action helped with the HBAR rally in July:
Hedera Watch
This steady accumulation has been a key driver of July’s gains. However, with whales already heavily allocated, there might be limited fresh capital left to sustain the same pace in August. Or they might again want to step in once the price starts dipping!
Any slowdown in whale buying could open the door for a pullback.
For token TA and market updates: Want more token insights like this? Sign up for Editor Harsh Notariya’s Daily Crypto Newsletter here.
Derivatives Positioning, OBV, And Bull-Bear Sentiment Are Mildly Bullish
The Bitget liquidation map shows long leverage vastly outweighing shorts ($122.75 million vs. $49 million), meaning the market is still positioned for upside. This skew adds risk: if price drops, liquidation clusters near $0.2182 could accelerate selling.
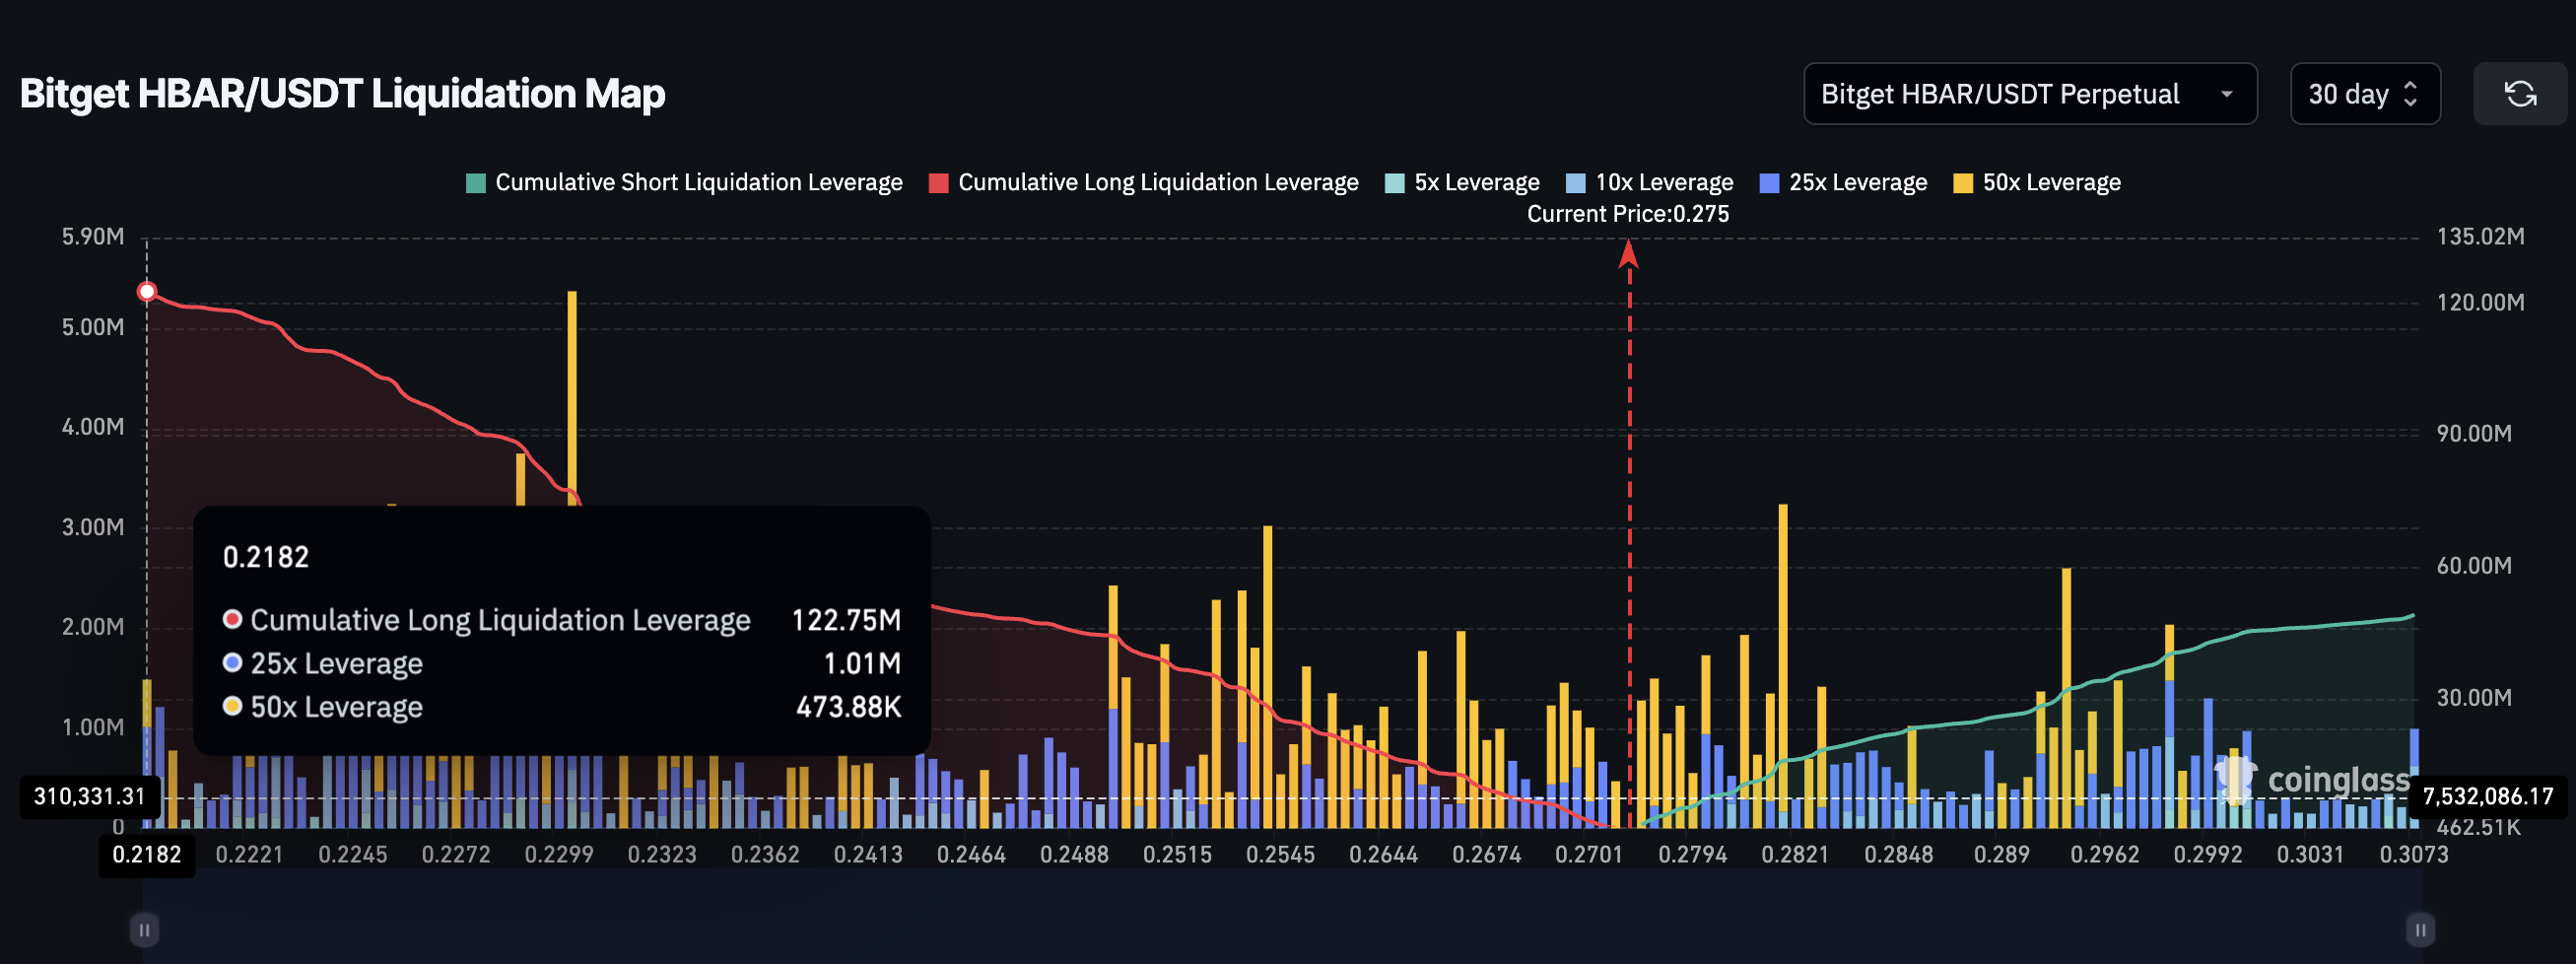 People are betting long on HBAR:
Coinglass
People are betting long on HBAR:
Coinglass
Meanwhile, On-Balance Volume (OBV) continues to trend upward, confirming that buying activity is still outweighing selling activity overall. However, even though OBV is making higher highs, it needs to stay above the 41.71 billion mark to sustain the HBAR price momentum in August.
On-Balance Volume (OBV) is a momentum indicator that tracks cumulative trading volume to show whether buying or selling pressure is dominating. A rising OBV suggests buyers are in control, while a falling OBV signals increasing sell pressure.
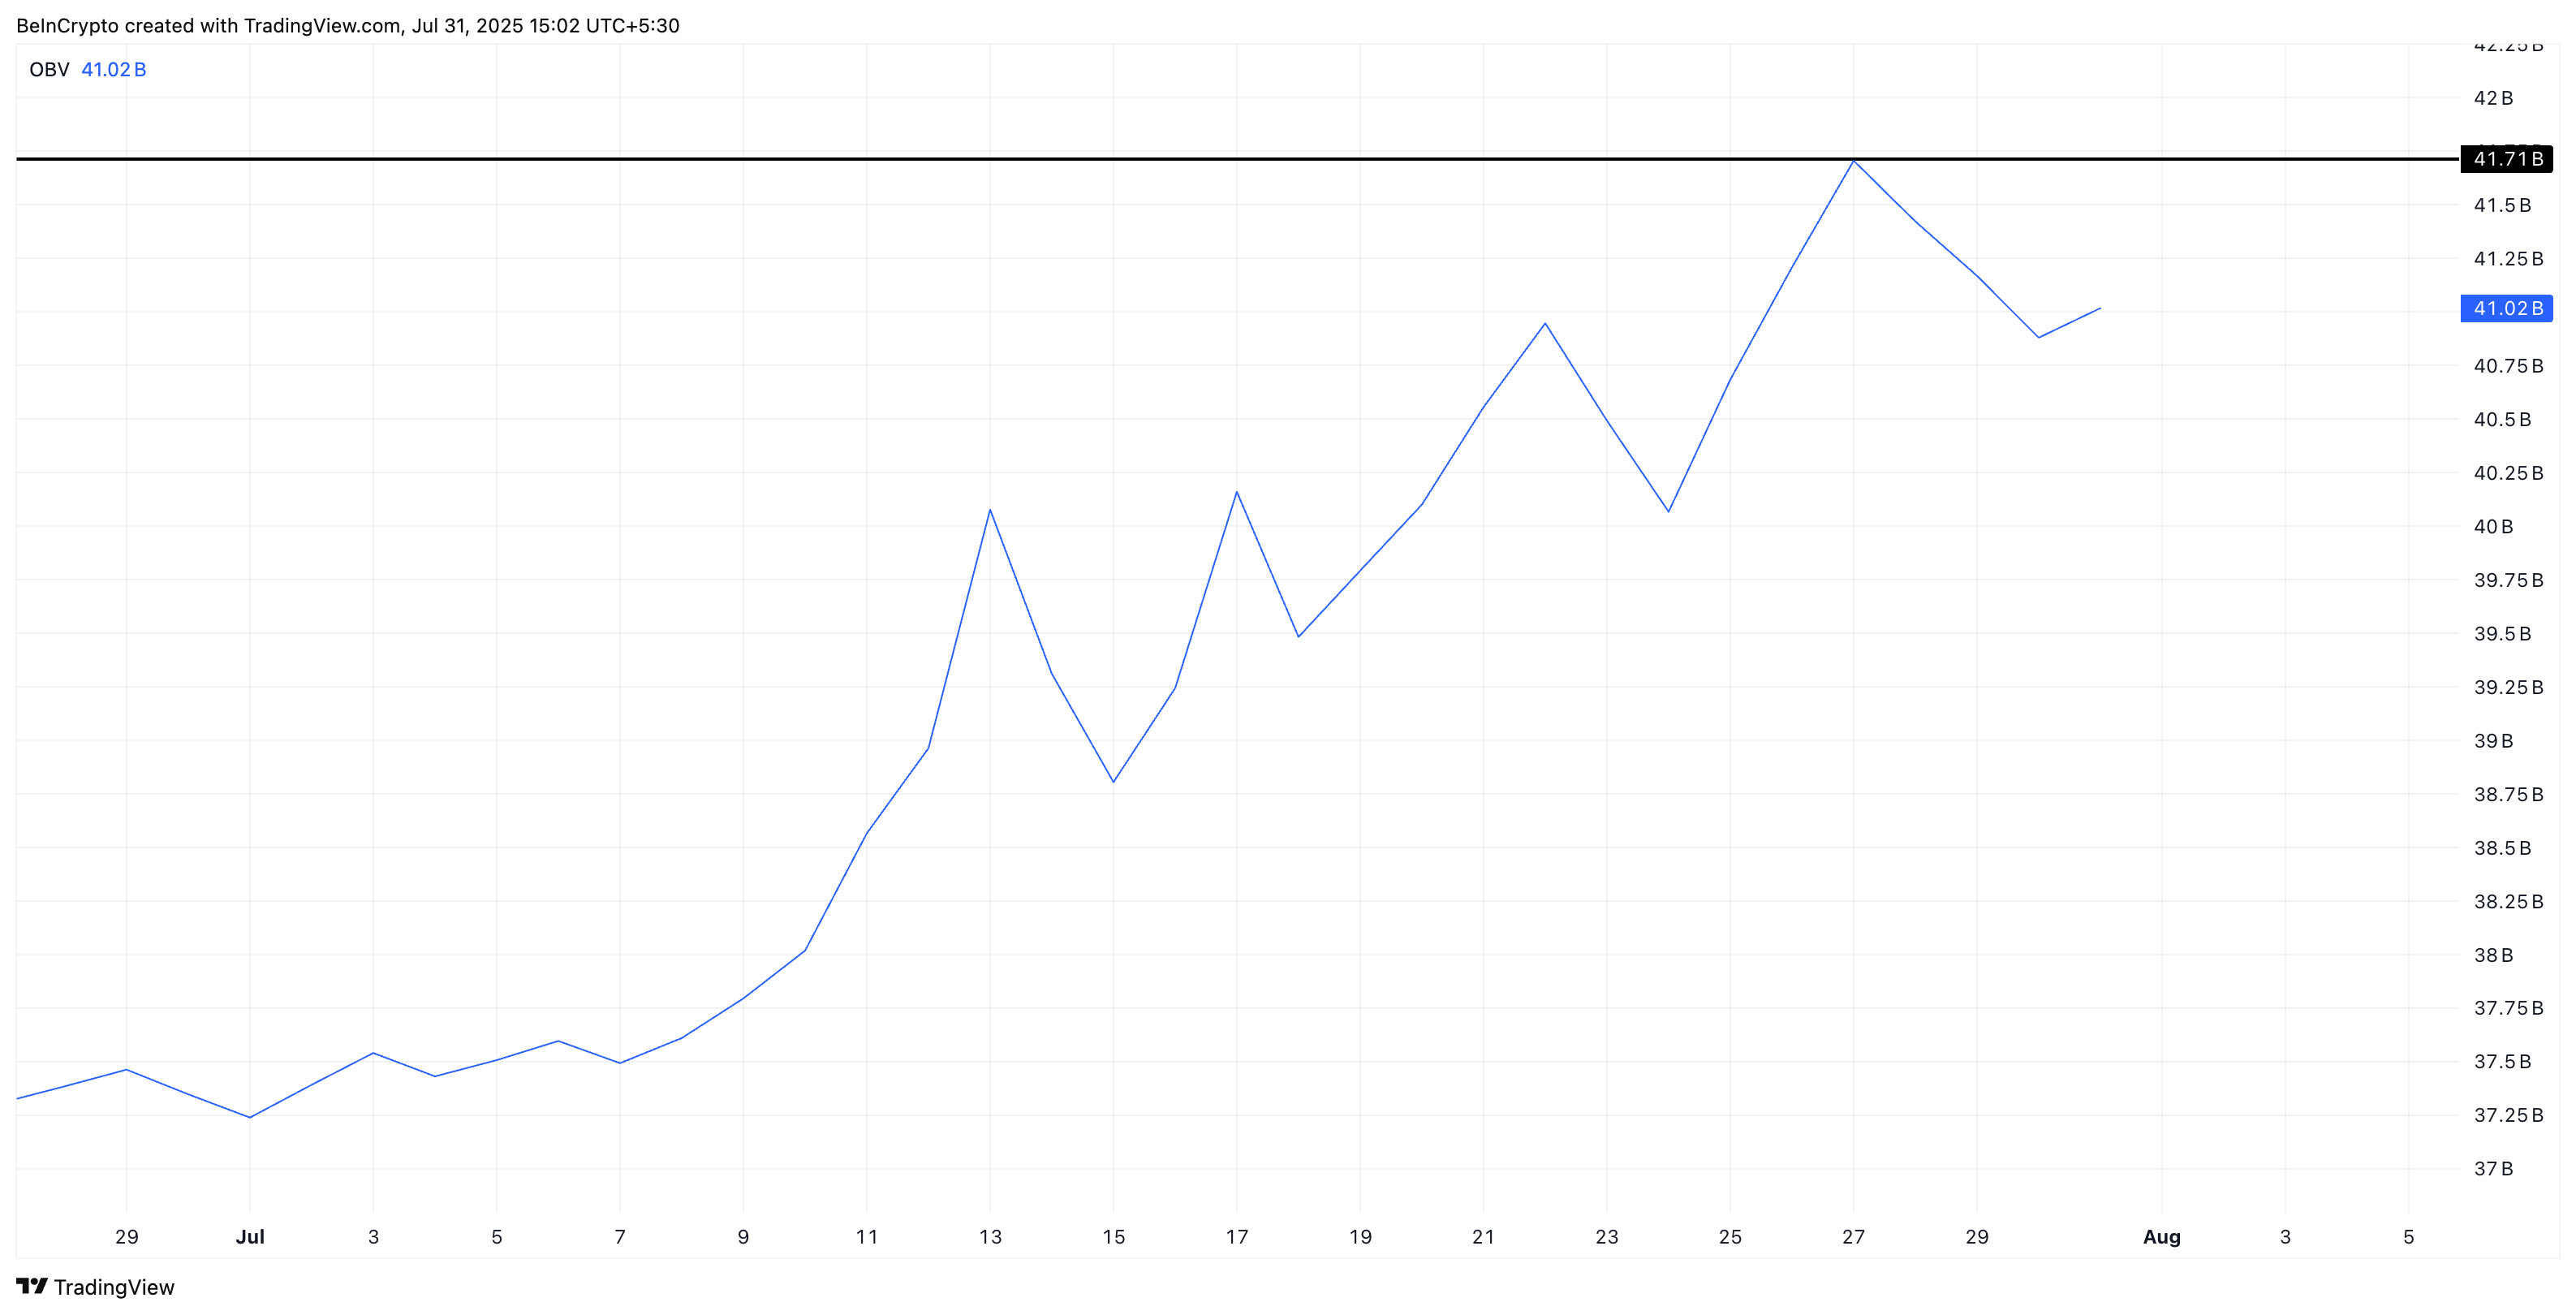 On balance volume supports the rally:
TradingView
On balance volume supports the rally:
TradingView
The Bull-Bear Power (BBP) indicator, which measures whether bulls or bears have stronger momentum, briefly turned negative in a single session last week but quickly flipped back green.
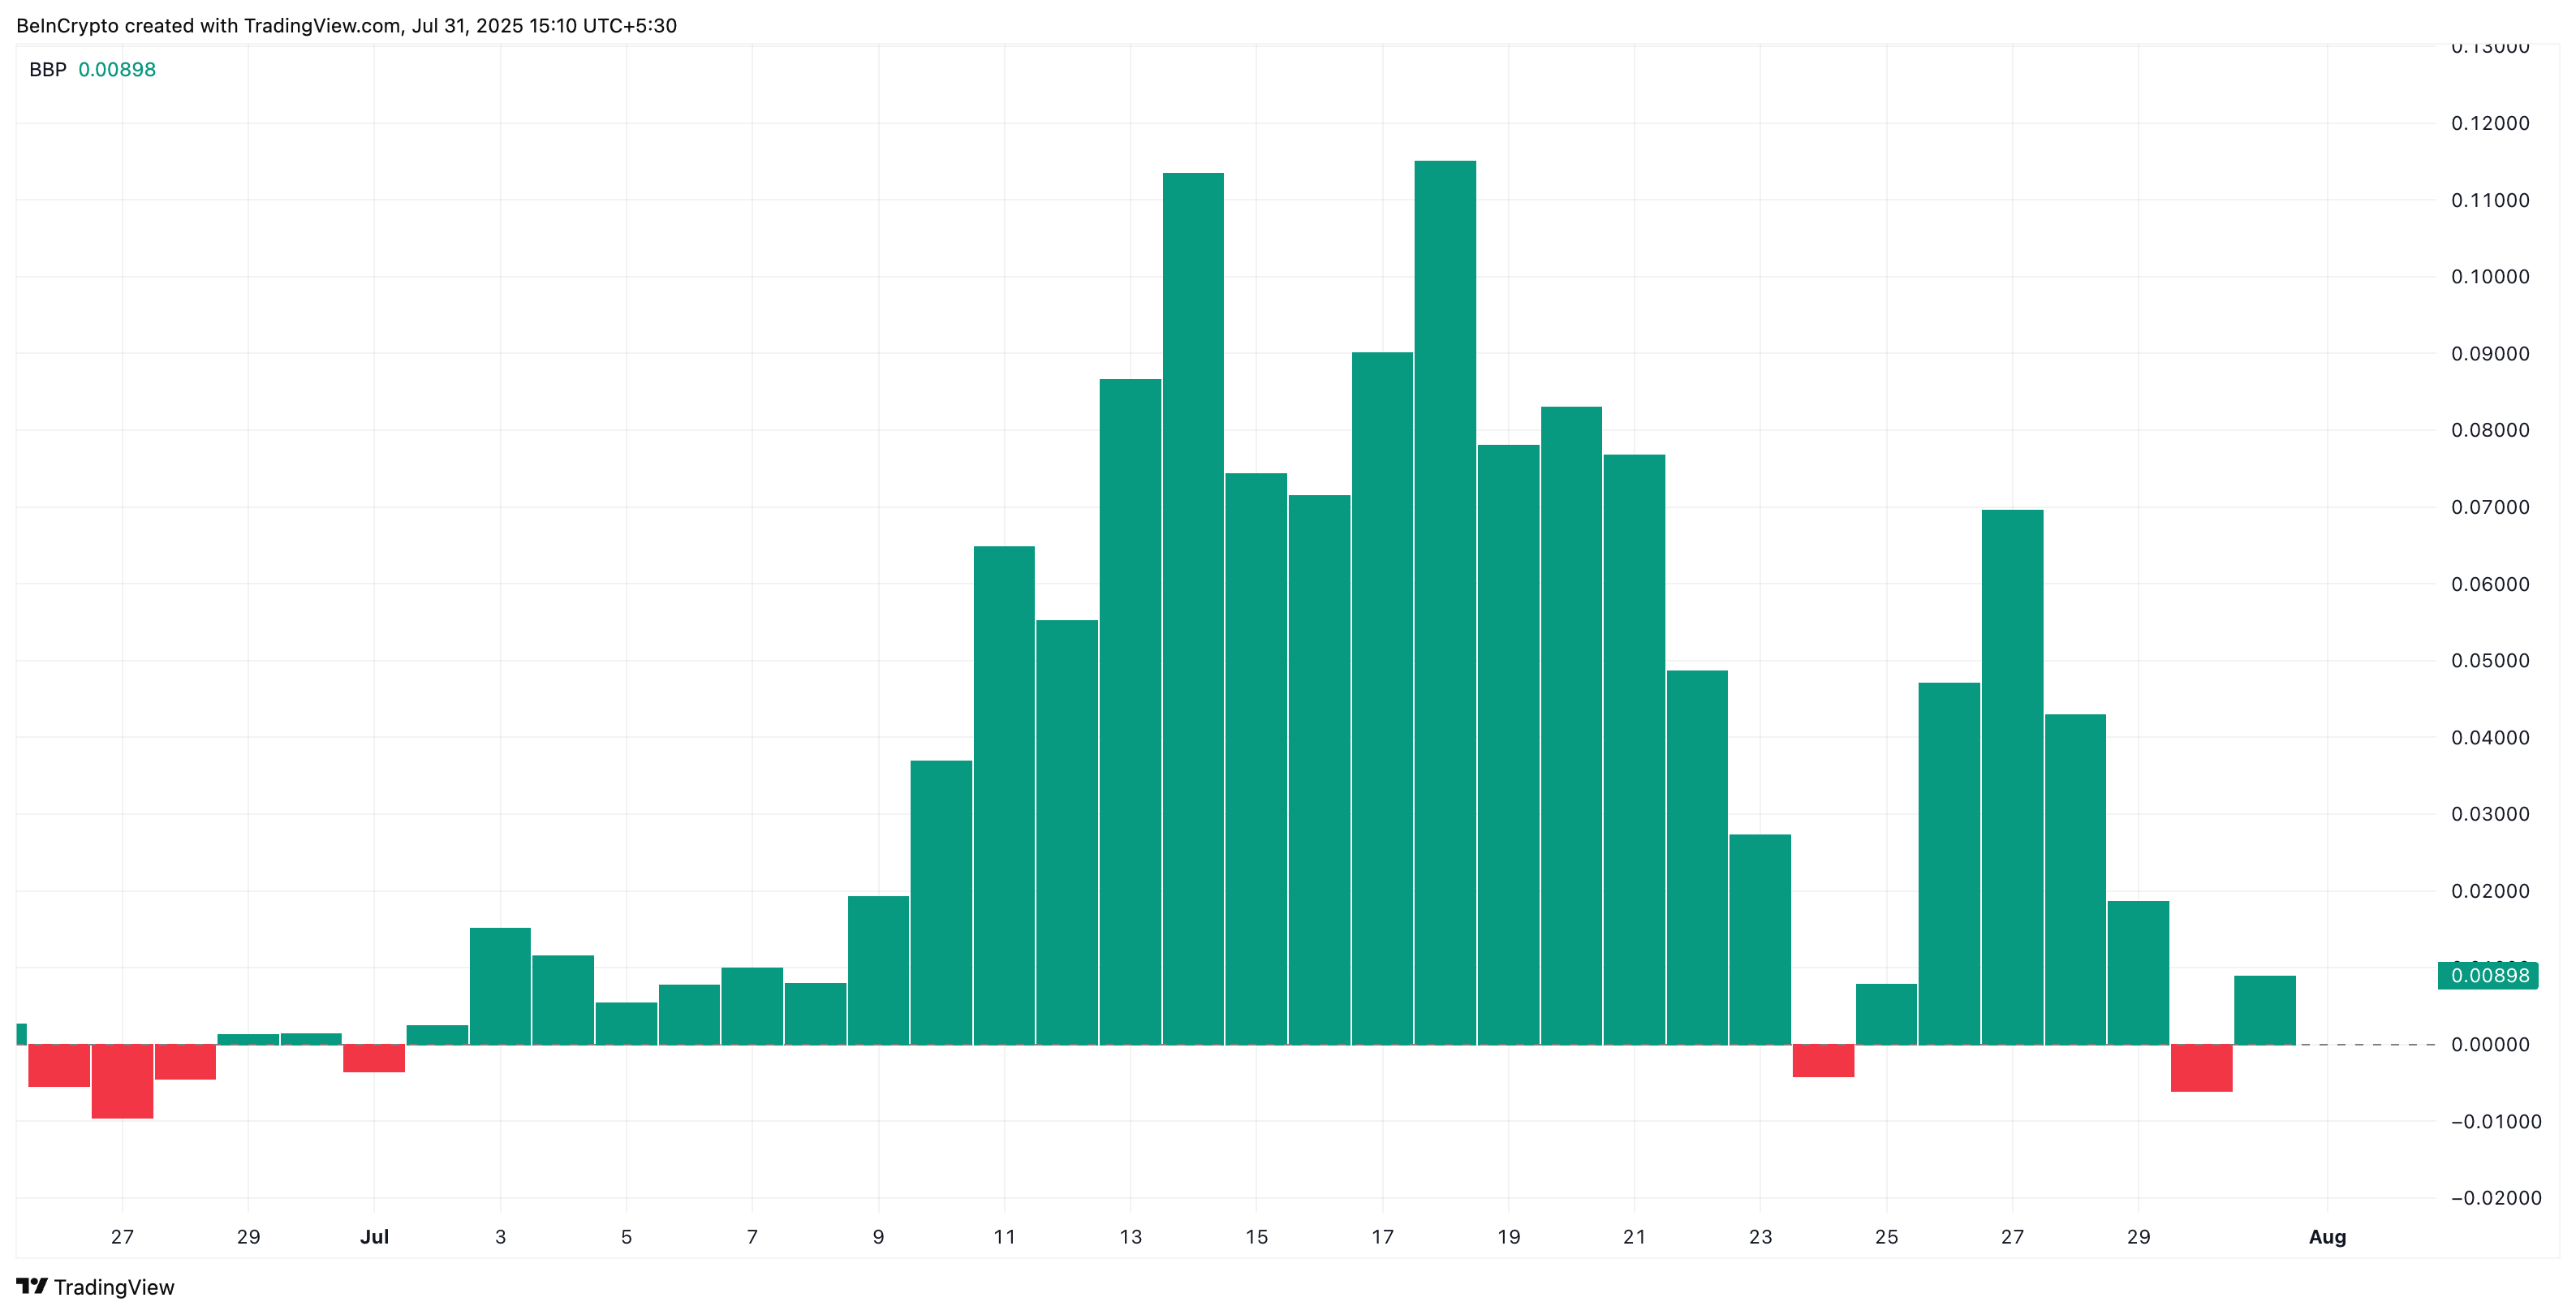 Bulls are in mild control:
TradingView
Bulls are in mild control:
TradingView
This shows bulls are holding control for now, but the grip is not unshakable. Hence, caution ahead!
HBAR Price Structure Tussles Between Weekly Triangle And Daily Supports: Who Wins?
The weekly chart paints a mixed picture, with HBAR consolidating inside a descending triangle, a formation that typically leans bearish even during an uptrend. If price fails to break above the triangle’s upper trendline near $0.30, history suggests August could bring a correction.
At present, two levels, $0.26 and $0.23, are lending support. If they break, the entire structure might turn bearish, rather quickly.
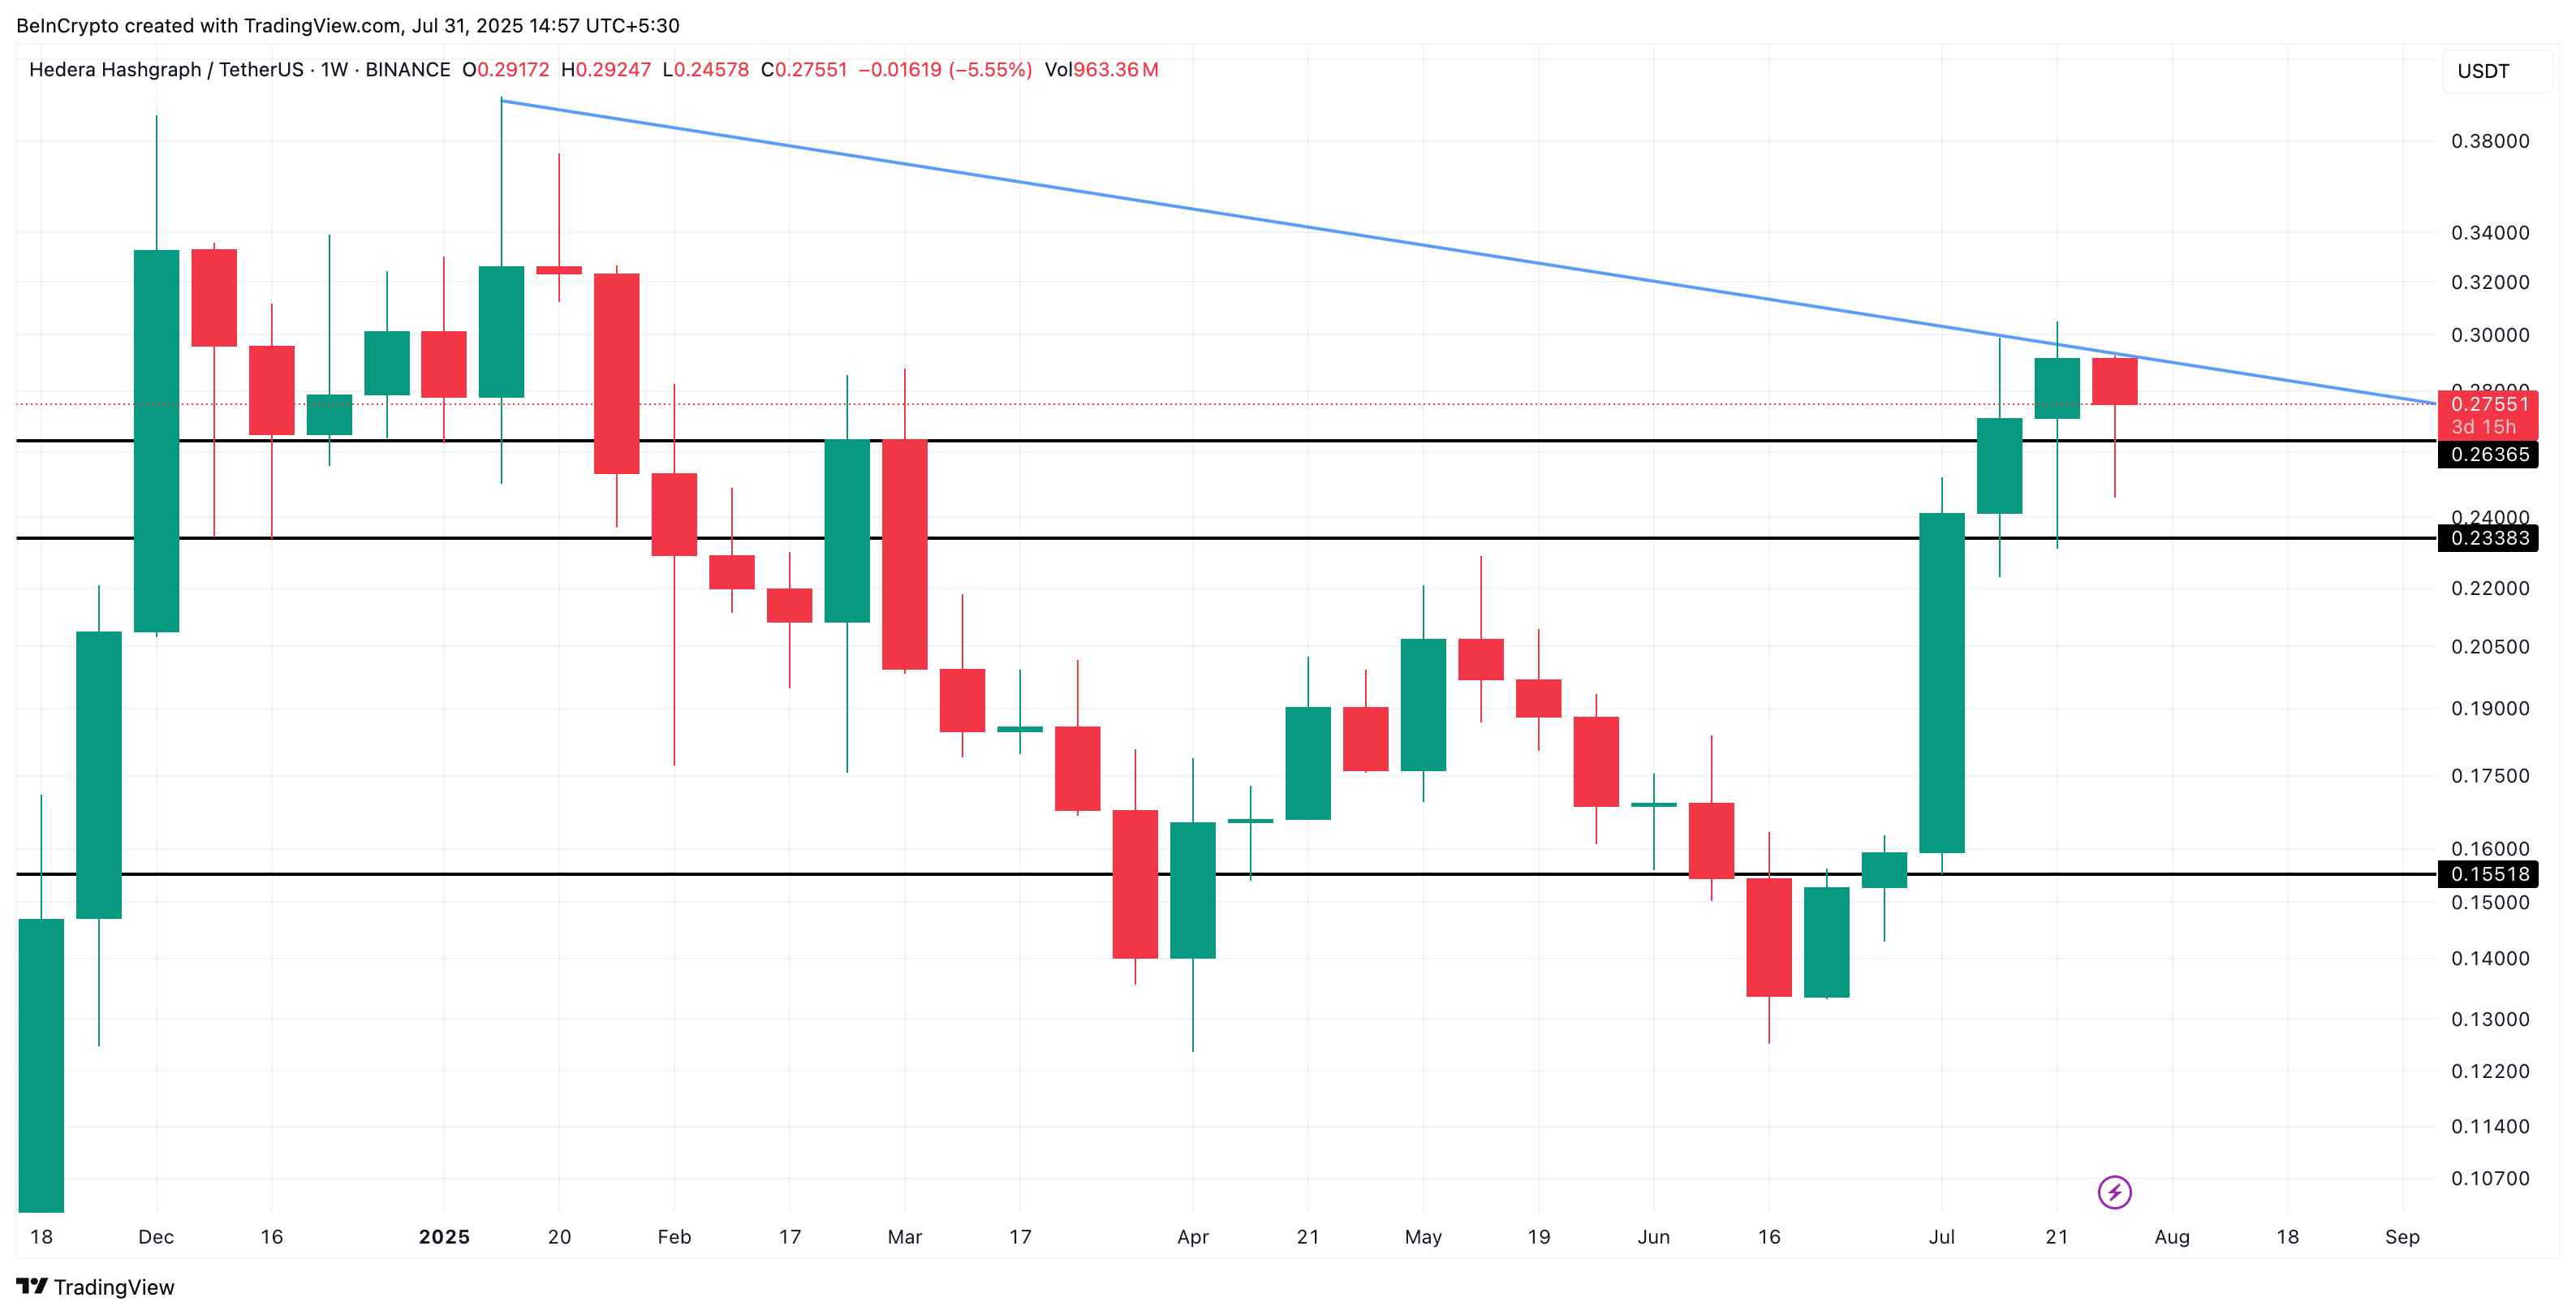 HBAR weekly price action:
TradingView
HBAR weekly price action:
TradingView
On the daily chart, Fibonacci retracement levels highlight the key battlegrounds.
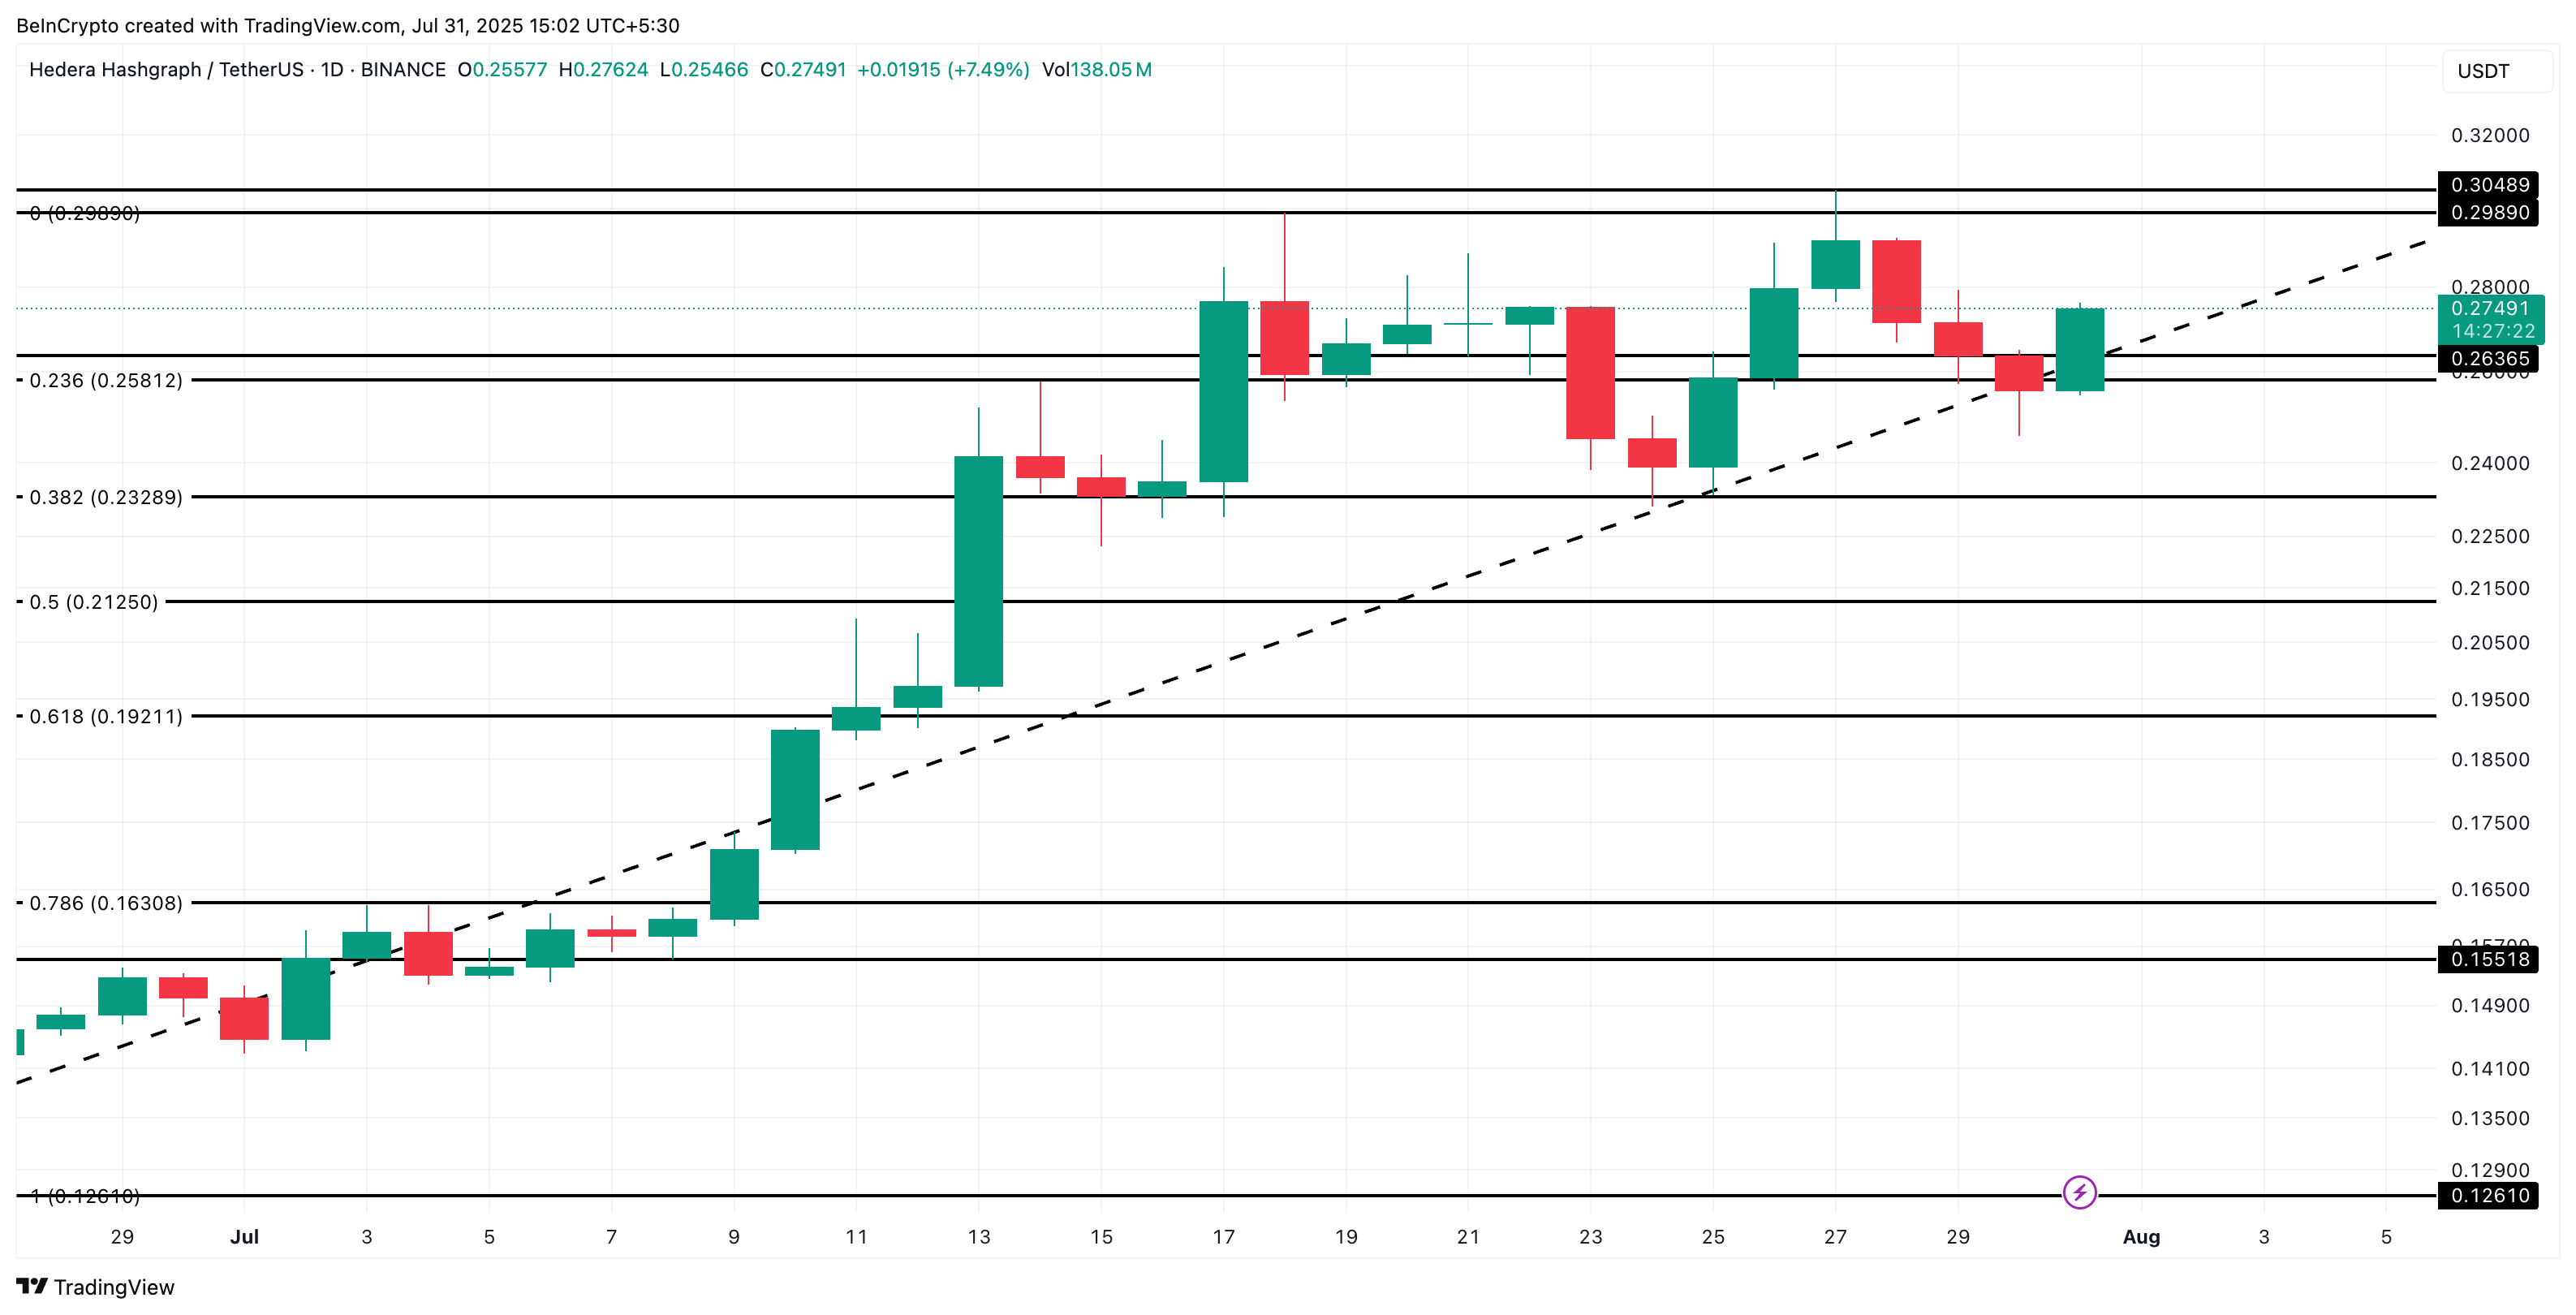 HBAR price analysis:
TradingView
HBAR price analysis:
TradingView
Immediate support sits at $0.26 (same as the weekly chart), followed by $0.23 and $0.21. If bulls defend these zones, a retest of $0.29–$ 0.30 remains possible. A clean breakout above $0.30 would be the clearest sign that August could defy its bearish history.
Disclaimer: The content of this article solely reflects the author's opinion and does not represent the platform in any capacity. This article is not intended to serve as a reference for making investment decisions.
You may also like
Samourai Wallet Founders Plead Guilty in $100 Million Bitcoin Laundering Case

Trump Media Confirms $2B Bitcoin Holdings and $300M Options Strategy in Q2 Filing

XRP Stalls at $2.86 as Key Support and Resistance Levels Contain Price Movement

ONDO Retraces Sharply as Price Stalls Below Resistance and $0.8507 Support Levels Take Priority