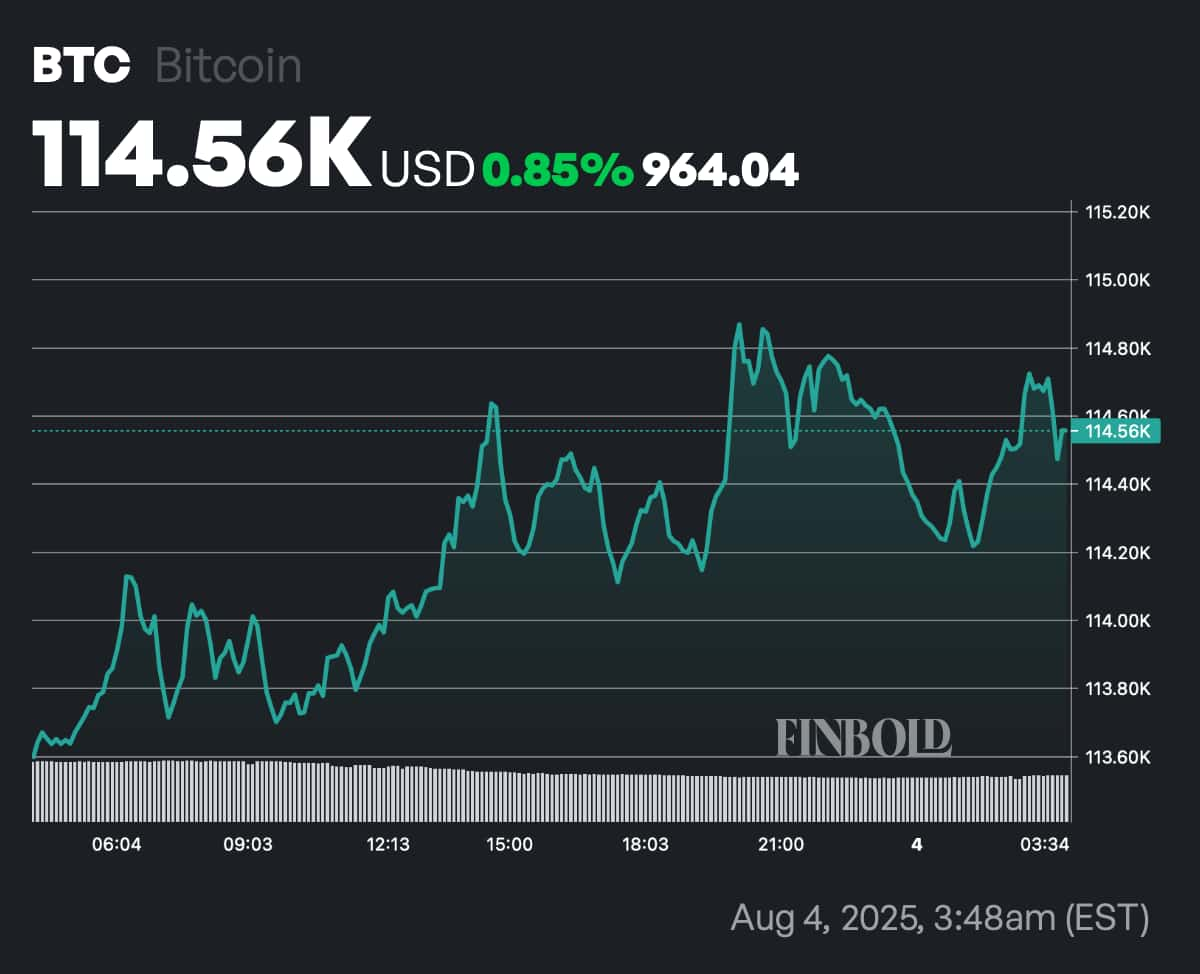
Bitcoin Price Just Broke Support — But Is This Actually a Buy Opportunity?
Bitcoin Dips Below Support — But the Bigger Trend is Still Bullish
$ Bitcoin has pulled back sharply in recent days, dropping from the $118K range to the $113K level, breaking below the key $115K–$116K support zone. But despite the short-term weakness, BTC is still trading well above its 200-day SMA and remains up significantly year-to-date.
Let’s break down what the chart says and why this might be a healthy correction rather than a bearish reversal.
BTC/USD 1-day chart - TradingView
Key Technical Levels and Indicators
- Support Just Broken: $ BTC broke below ~$116K (orange line), the previous support turned resistance.
- Current Price: ~$113,932
- 50-day SMA: ~$112,110 (holding as immediate support)
- Next Major Support: ~$111,350 (horizontal structure)
- 200-day SMA: ~$99,280
- RSI (14): Rebounded from 45.12, suggesting neutral territory — not oversold yet.
The move down is notable, but BTC is still well above the 200-day SMA, which keeps the long-term uptrend intact . The RSI is also recovering from local lows, hinting that bears may be losing momentum.
Bitcoin Analysis: Suggested Buy Zones
For those looking to buy the dip or scale in:
$112,000 – $111,000 Zone
This is a key confluence of support: 50-SMA and recent structure. As long as BTC stays above here, it could be a low-risk buy zone.
$100,000 – $99,280 Zone
Strong psychological and structural support, backed by the 200-SMA. If BTC drops this far, expect heavy accumulation.
$75,000 (Extreme Bear Scenario)
This would represent a 35% drawdown from the recent top — ideal for long-term entries if macro turns ugly.
Bitcoin Price Prediction: Watch These Zones for Exits or Risk Management
$116,000 – $118,000
Recently lost support. If BTC pushes back into this zone but fails to hold, it could become a bull trap. Be cautious.
Break Below $111,000
If BTC closes below this level with strong volume, expect a drop toward $100K or lower.
Final Thoughts: Will Bitcoin Price Recover?
Bitcoin is in the middle of a healthy correction — and while short-term sentiment has turned cautious, long-term structure is holding. Unless BTC breaks below $100K, this dip could offer one of the last major buy zones before the next leg higher.
Whales , institutions, and long-term holders will likely be watching the $111K and $100K areas closely. And you should too.
Disclaimer: The content of this article solely reflects the author's opinion and does not represent the platform in any capacity. This article is not intended to serve as a reference for making investment decisions.
You may also like
Bitcoin or Ethereum? We asked ChatGPT which crypto is a better buy for 2025 H2

VanEck Says Bitcoin Would Reach Half the Value of Physical Gold
Robert Kiyosaki Warns of Bitcoin August Curse, Says “If BTC Crashes, I’ll 2x My Position”
Ethereum Reserve Amasses 15,846 ETH in Large Transaction

