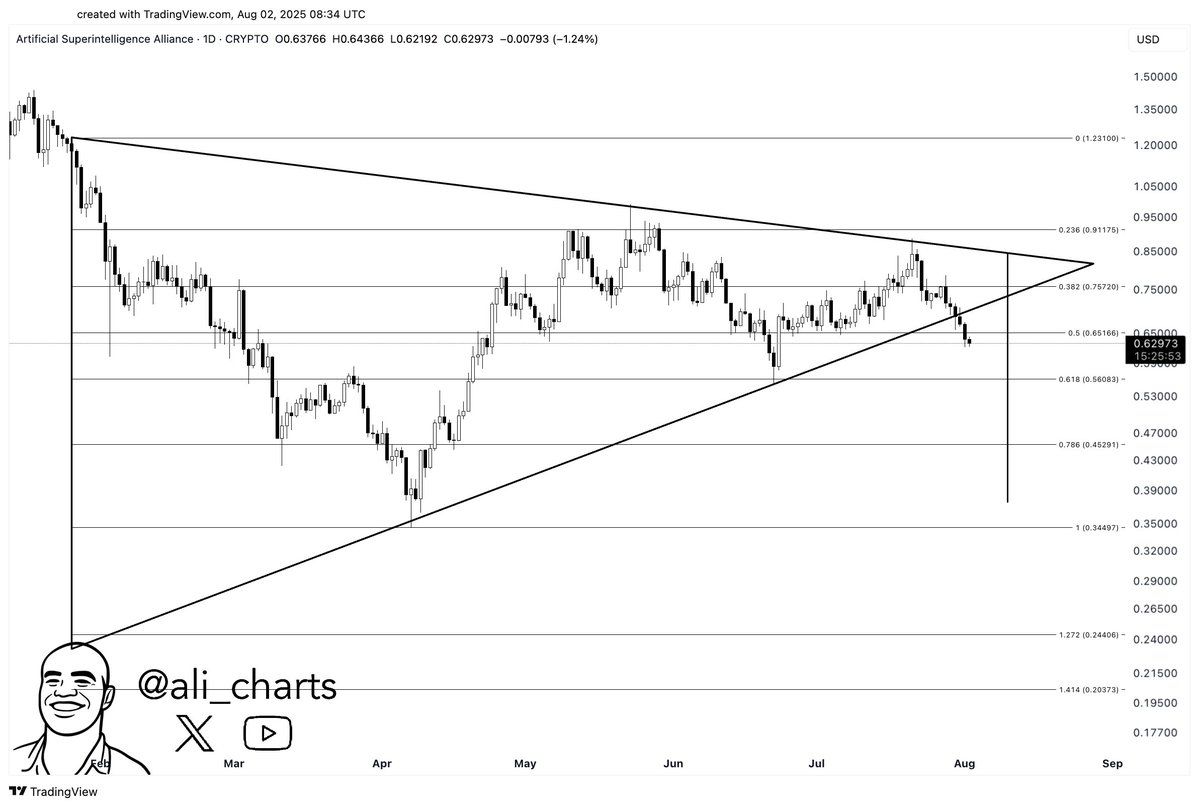
- FET’s six-month triangle broke down near $0.66, flipping sentiment bearish as traders eye deeper Fibonacci support around $0.56 to $0.49.
- Despite the recent dip, FET still respects its macro trendline from 2022,but a close below $0.60 could flip the long-term script.
- Elliott Wave analysis warns of a wave C extension, with the $0.49 zone flashing red as a likely landing spot if bulls stay sidelined.
FET’s recent price action signals a clear shift in momentum after a critical breakdown from a symmetrical triangle. Once a bullish consolidation zone, the pattern’s failure now points to downside continuation. The token has dipped to around $0.6239, extending a 7-day slide of more than 15%.
Triangle Breakdown Shakes Bulls’ Confidence
As highlighted by Ali Charts , the daily FET chart shows a decisive break from a symmetrical triangle pattern that formed over six months. The structure, bounded by a rising support line and descending resistance, held since February but failed to sustain in late July.
 Source: ali_charts
After losing the 0.5 Fibonacci retracement at $0.66166, FET dropped toward $0.62973 with a 1.24% daily decline.The triangle’s measured move now points to potential levels well below $0.34497, based on the height from apex to support.
The next major support sits around $0.56, on the 0.618 Fibonacci level. If it fails ,buyers could step in between $0.45 and $0.34 where price has bounced before during past dips.
Macro Structure Still Holds—but Barely
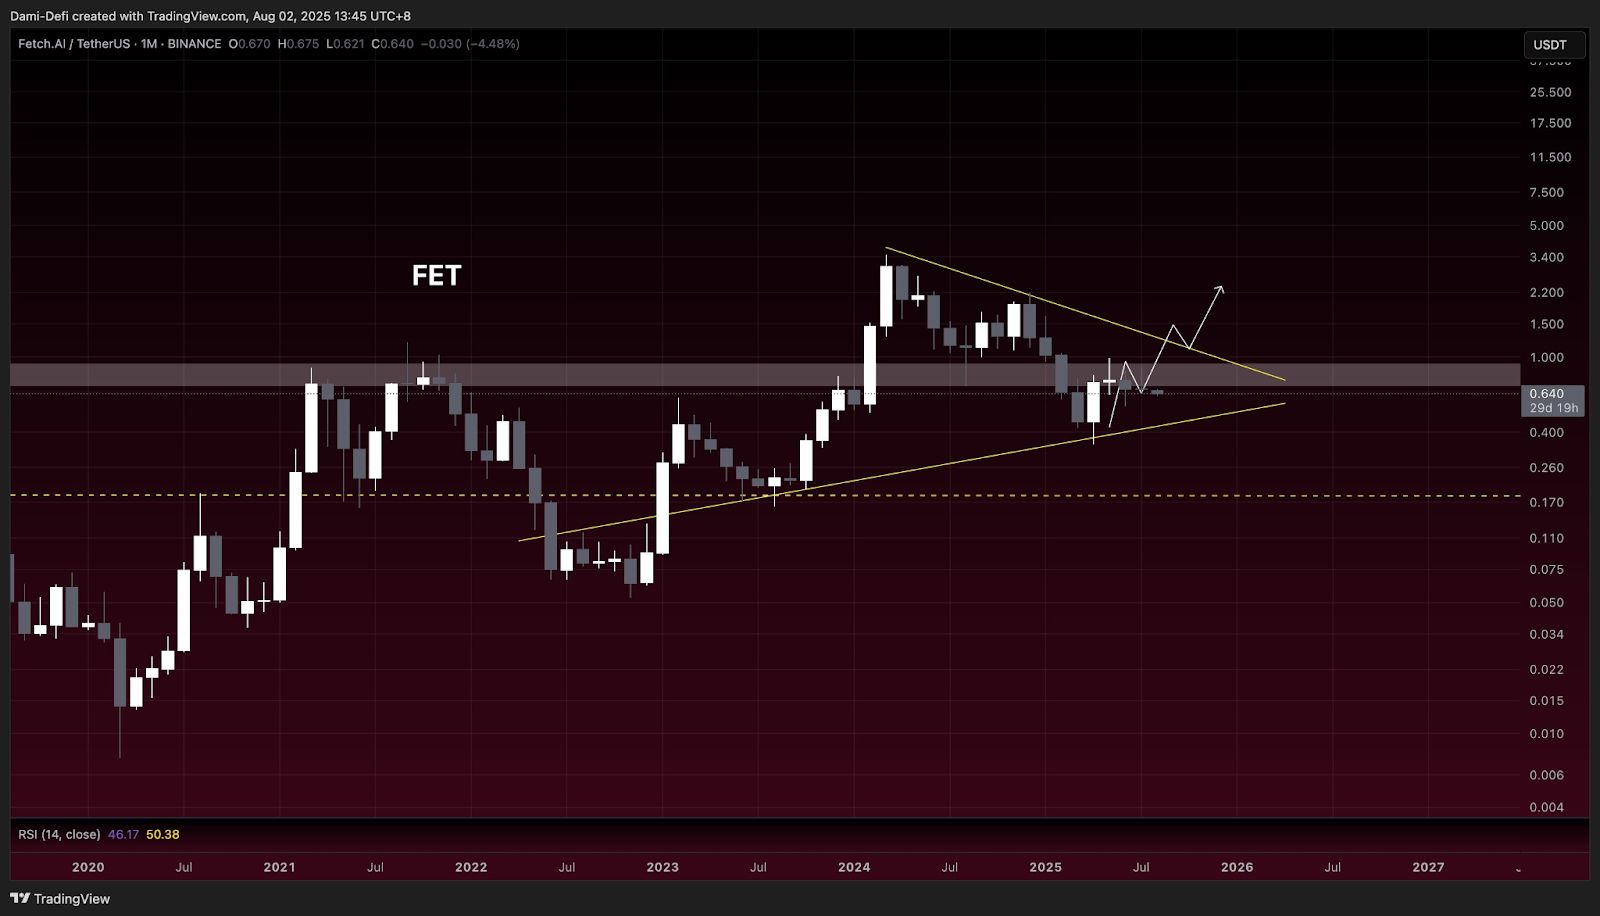
X user Dami-Defi shared a long-term monthly chart, showing a macro triangle from the 2021 peak and 2022 base. The price currently trades near the lower boundary of that structure. Despite the recent bearish move, FET continues to respect higher lows that have persisted since early 2022.
 Source: DamiDefi
Resistance near $0.95–$1.10 has capped upside attempts since late 2023. The monthly RSI hovers between 46 and 50, showing a lack of strong momentum in either direction. As long as the structure remains intact, long-term holders may still view this as a consolidation phase.
Fibonacci and Wave Count Suggest Deeper Levels Ahead
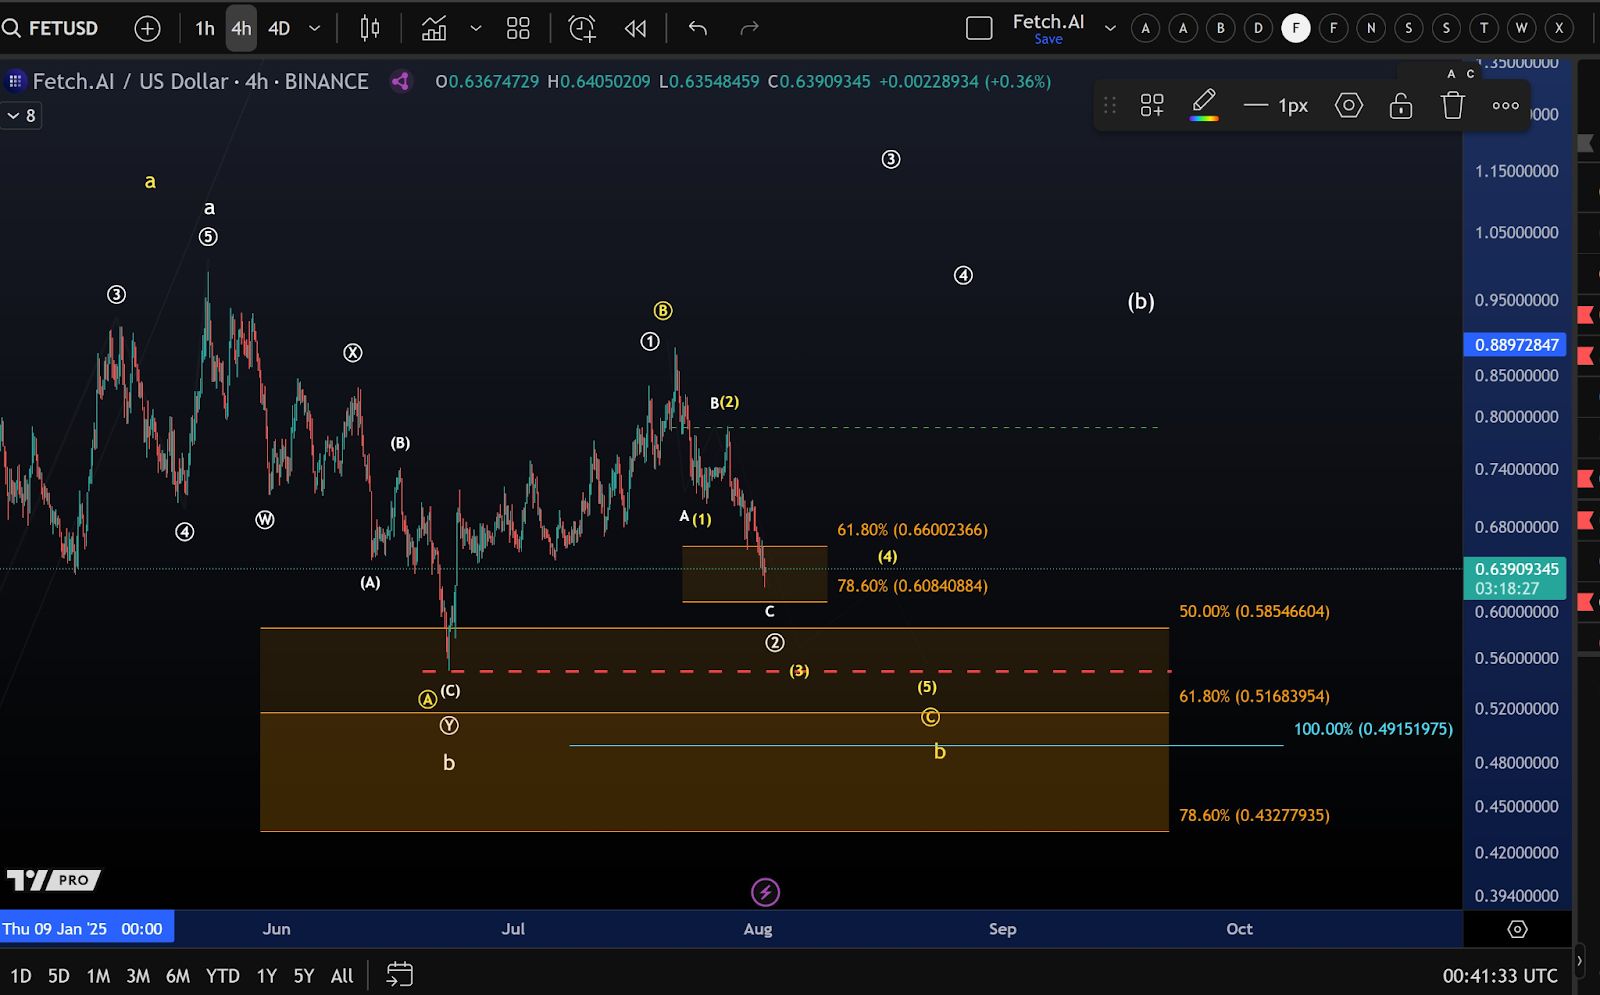
Another analyst, More Crypto Online, offered an Elliott Wave perspective using the 4-hour chart. According to the wave count, FET is nearing the end of a corrective phase, with wave C pushing into a key Fibonacci confluence zone between $0.660 and $0.608.
Source Morecryptoonl
If this zone fails, the next likely destination lies between $0.516 and $0.49—also backed by the 100% retracement level of the wave count. This aligns with broader market weakness and the continuation of a corrective cycle that could stretch into early September.FET’s short-term outlook remains fragile, but key long-term structures still offer hope to bulls.