The Bitcoin price today is holding around $117,600, showing mild losses on the session after a volatile dip to $116,500. Price action continues to oscillate within an ascending channel structure that has guided BTC higher since March. Despite the broader bullish bias, rejection from the $122,500 zone earlier this week has left buyers struggling to reclaim momentum, while exchange flows hint at distribution pressure.
What’s Happening With Bitcoin’s Price?
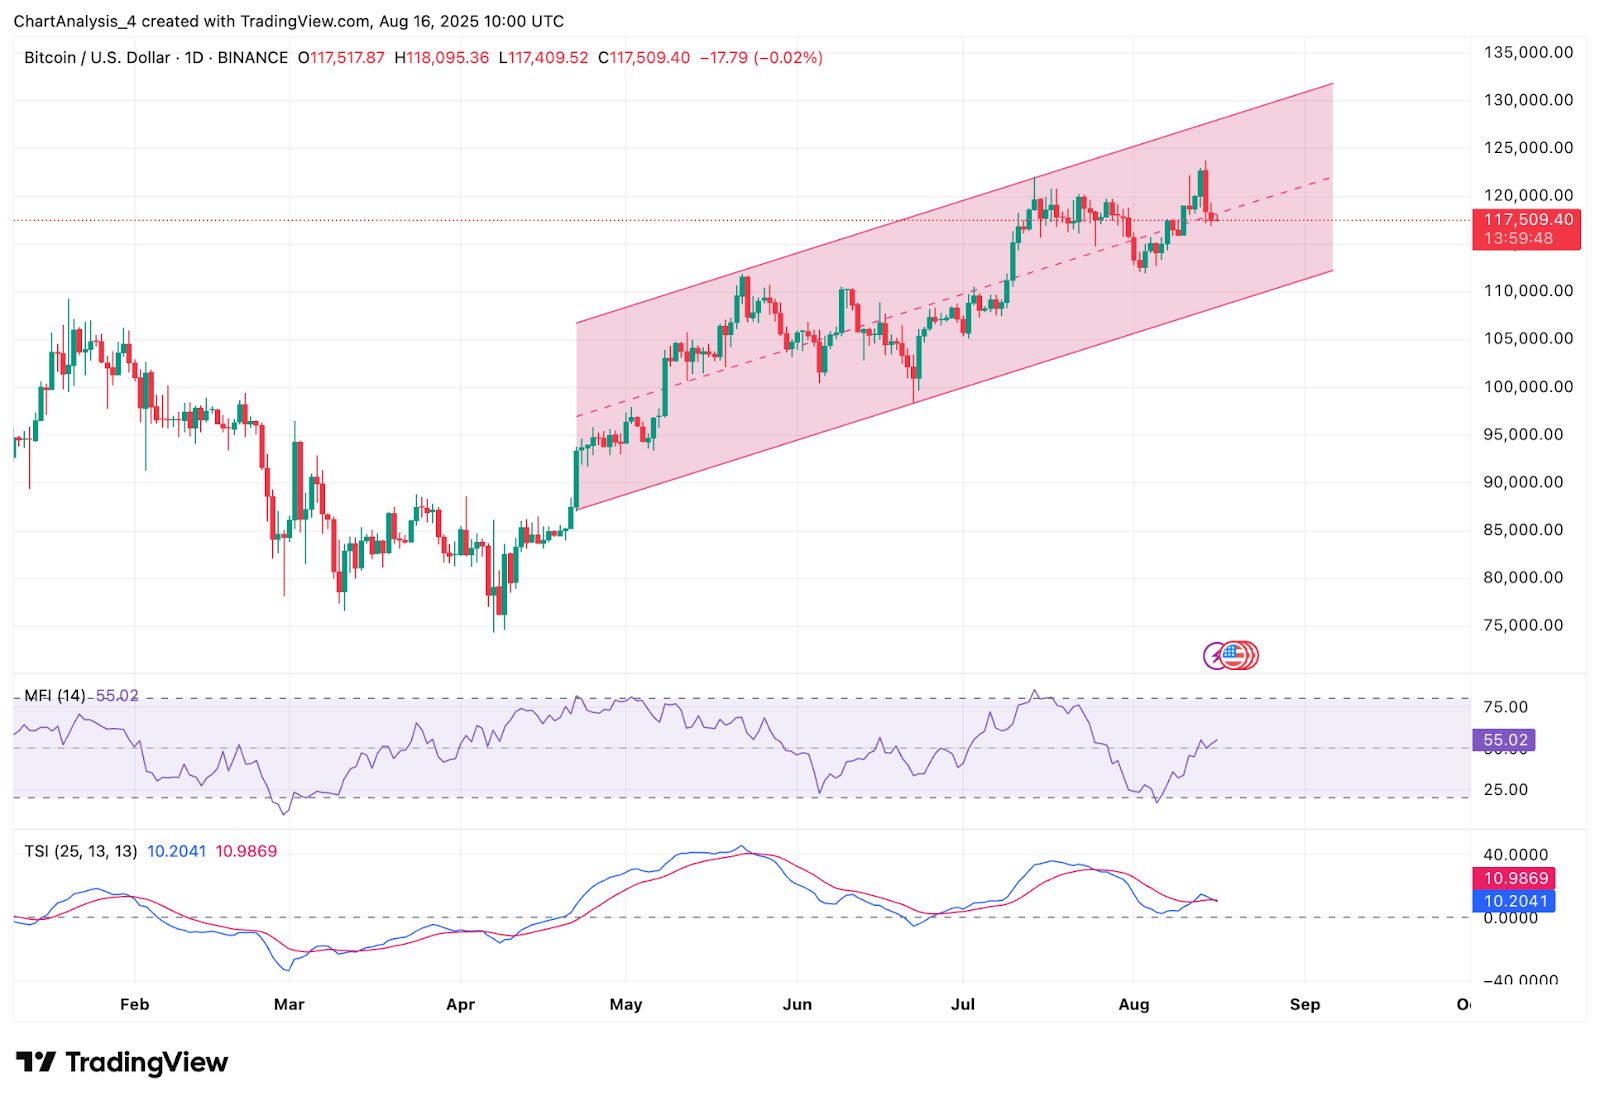 BTC price dynamics (Source: TradingView)
On the daily chart, BTC remains inside a rising channel, with the midline near $117,200 currently acting as pivot support. The structure remains bullish as long as price stays above $113,500, the lower channel boundary. RSI holds near 55, suggesting neutral momentum, while the True Strength Index has flattened around 10, showing waning bullish drive after weeks of gains.
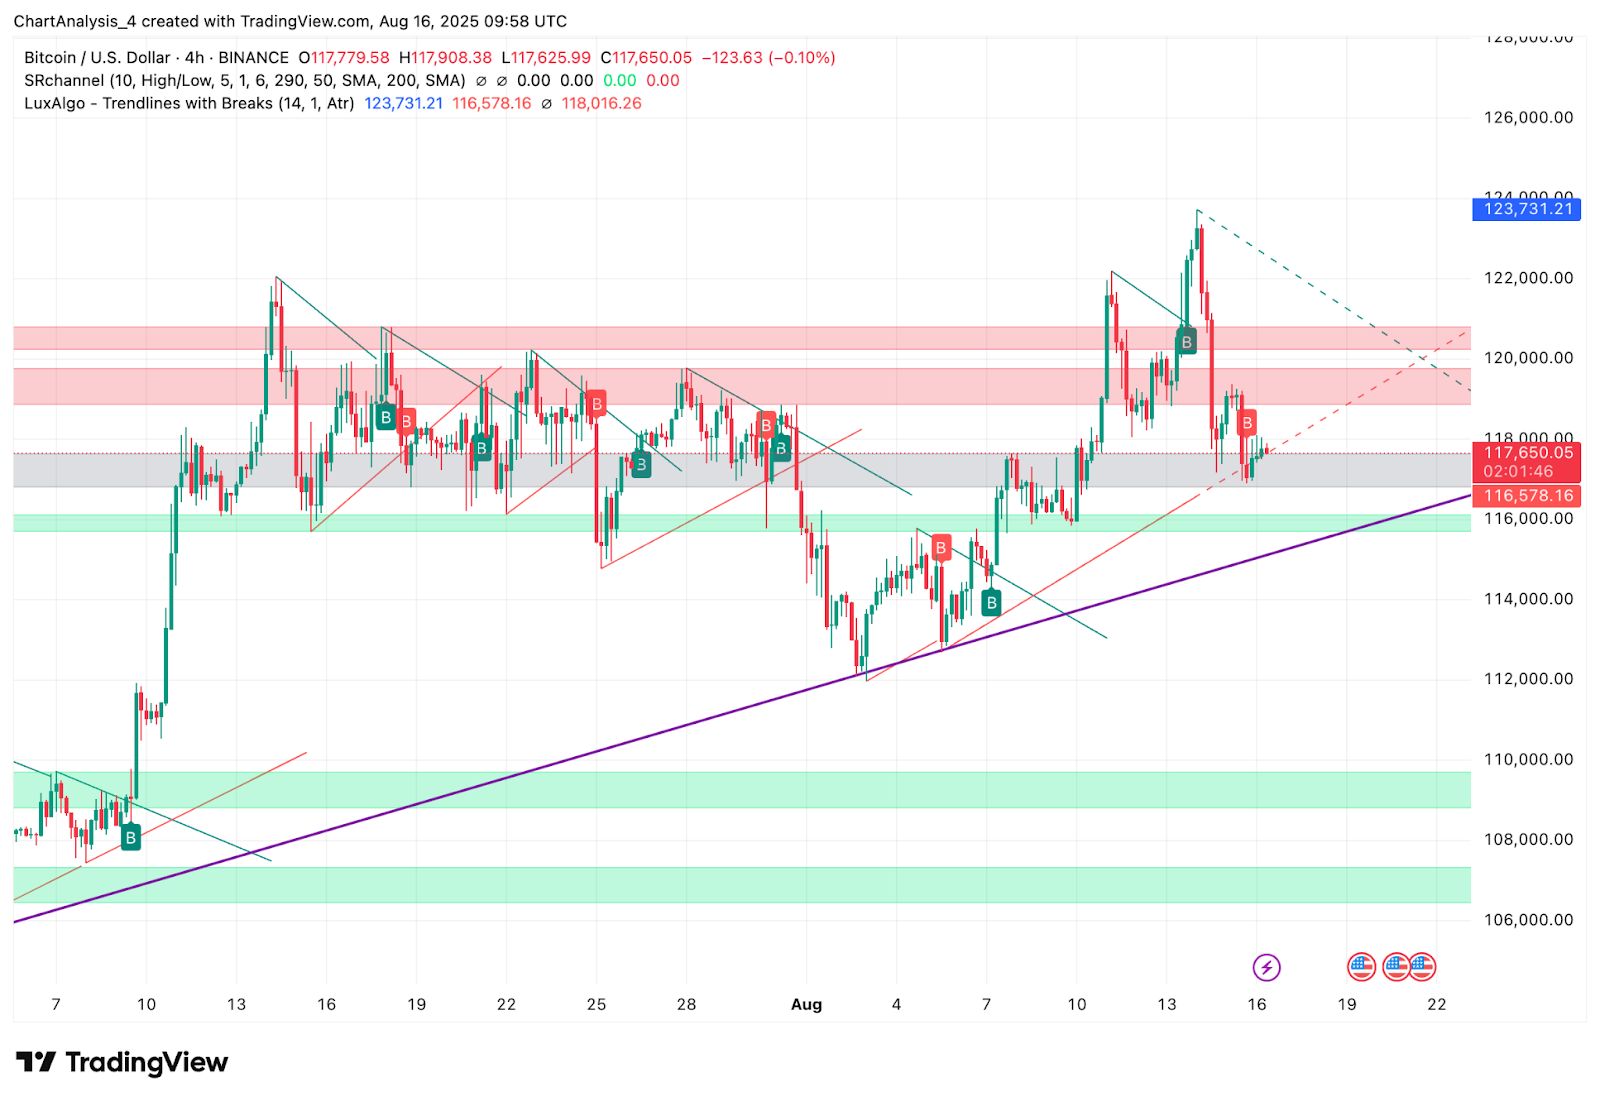 BTC price dynamics (Source: TradingView)
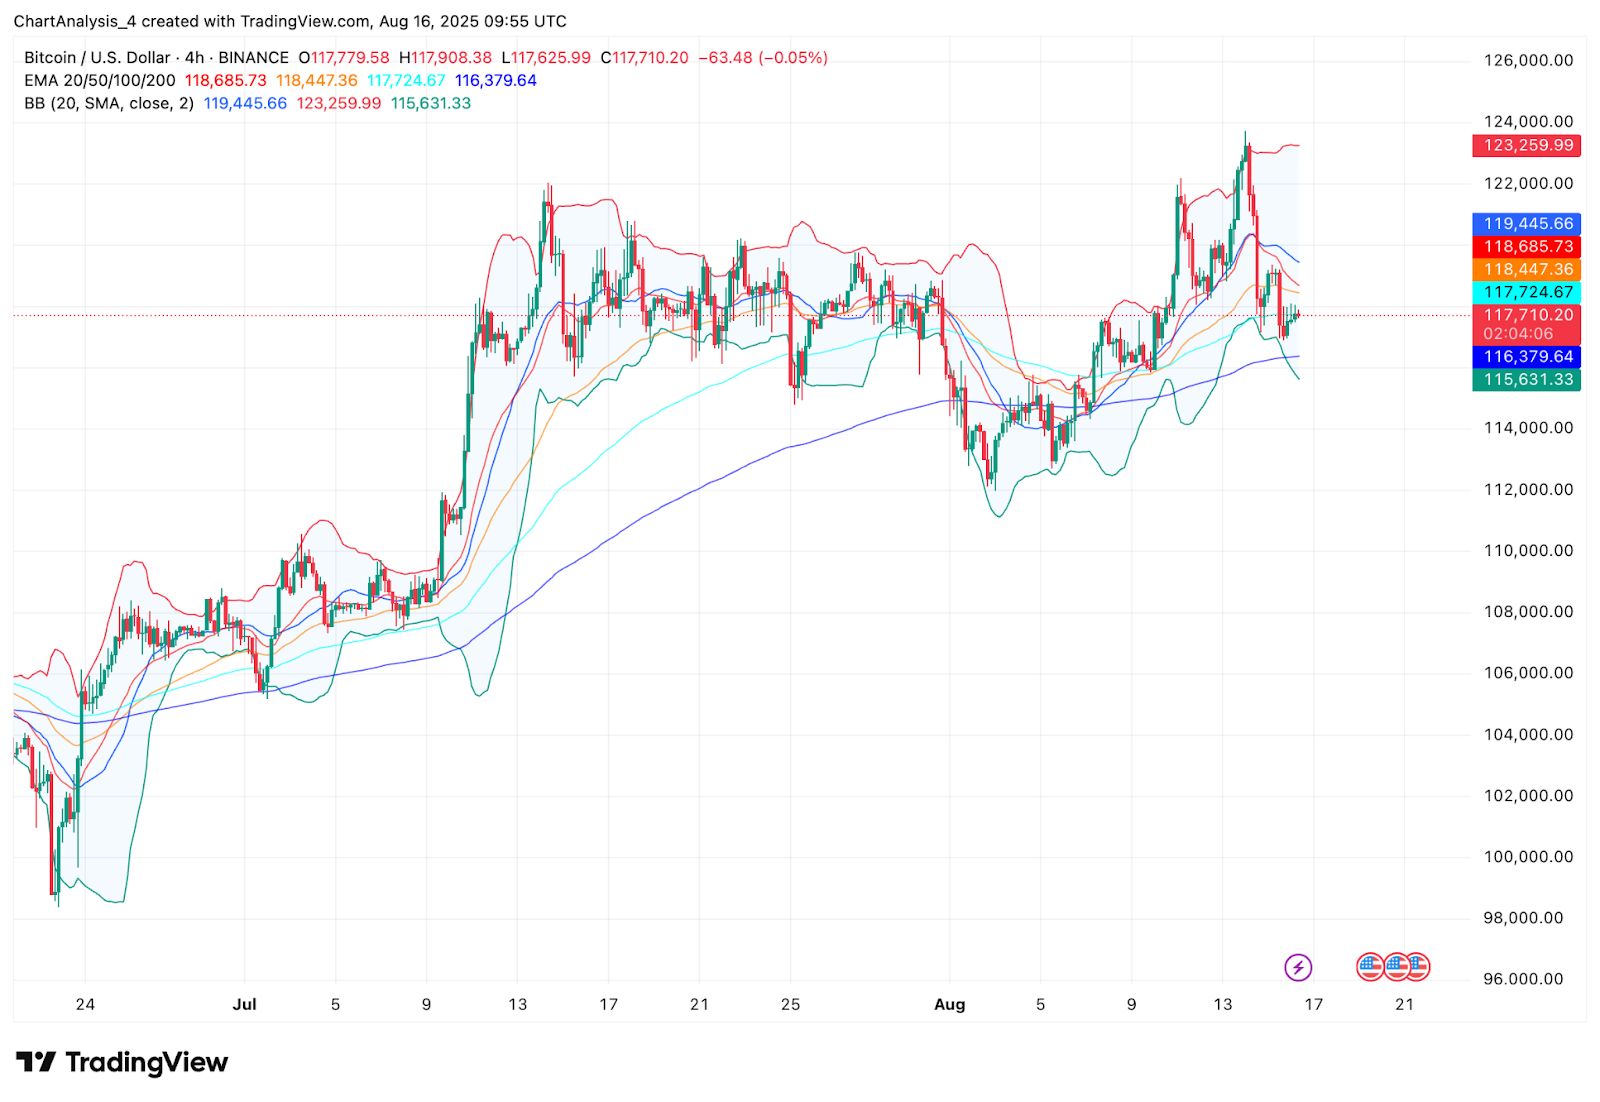
The 4-hour chart highlights BTC trading between dynamic support at the 200 EMA ($116,380) and resistance at the 50 EMA ($118,447). Bollinger Bands are tightening around $117,700, signaling compression ahead of a volatility expansion.
Why Is The Bitcoin Price Going Down Today?
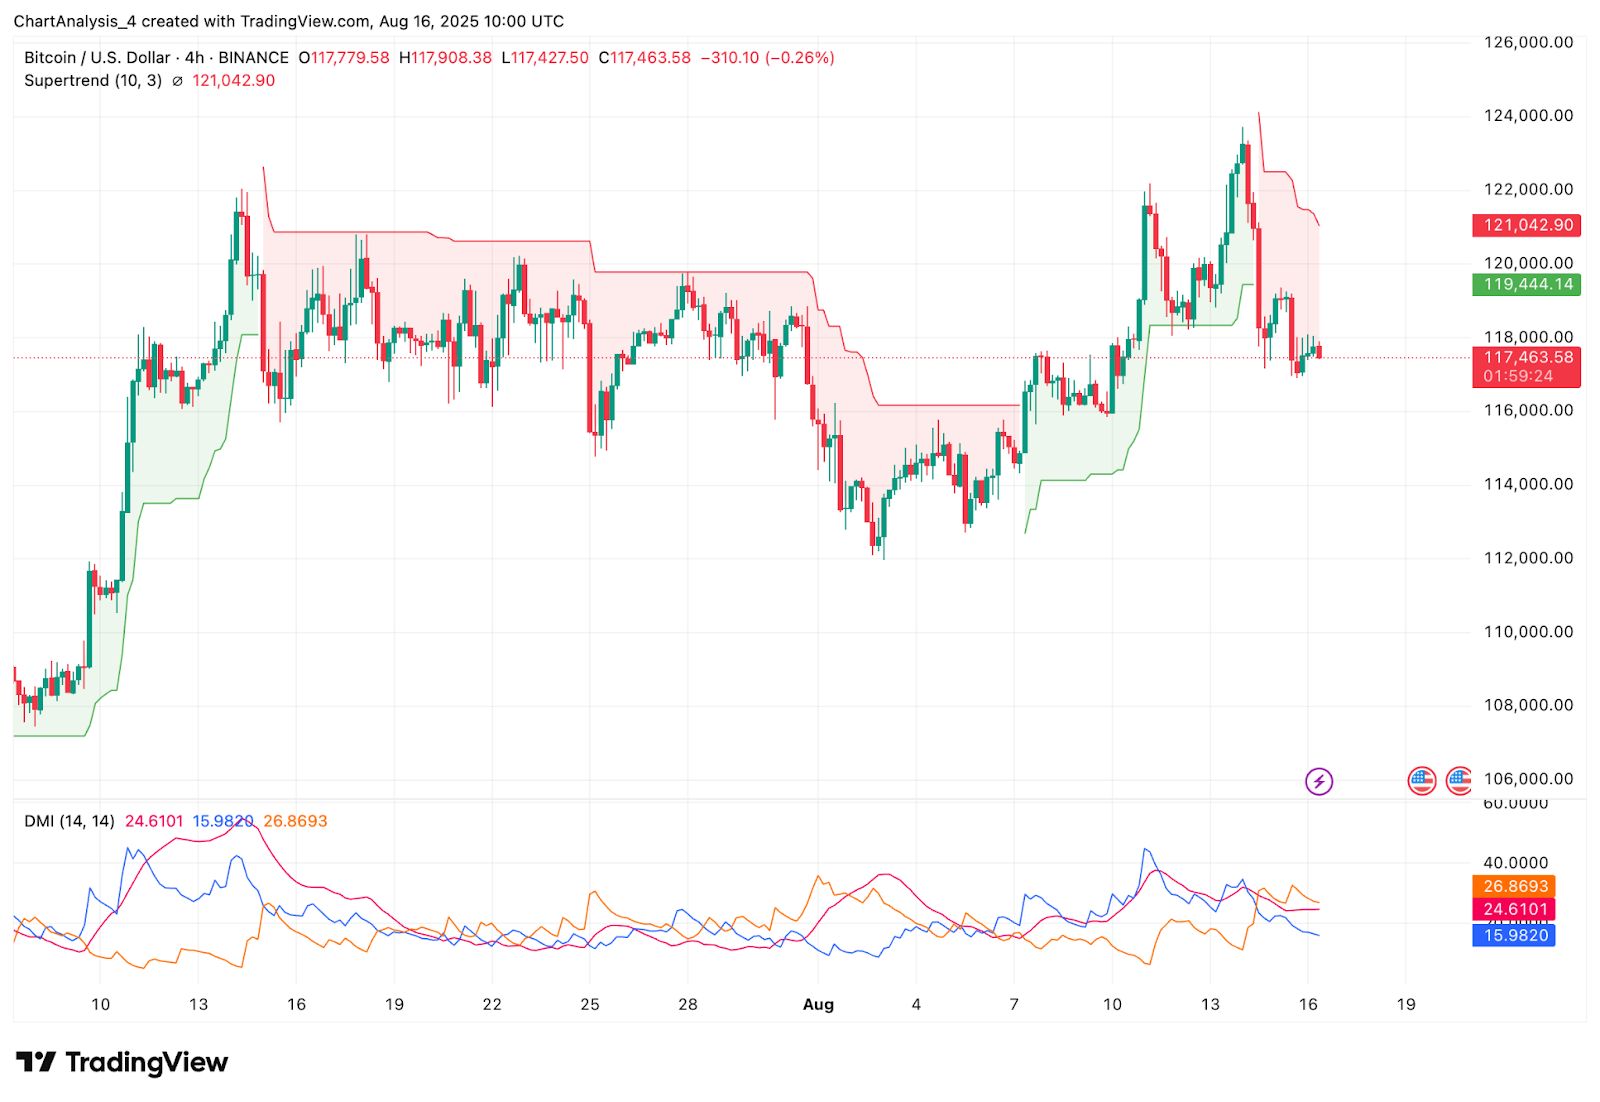 BTC price dynamics (Source: TradingView)
Multiple rejections at $122,000–$122,500 and a supply zone also flagged by Fibonacci 0.382 resistance contribute to the short-term weakness in the Bitcoin price. The Supertrend indicator has flipped bearish under $121,000, reinforcing this pressure. Meanwhile, DMI readings confirm a cautious environment, with -DI at 26.8 slightly above +DI at 24.6, showing sellers holding a marginal edge.
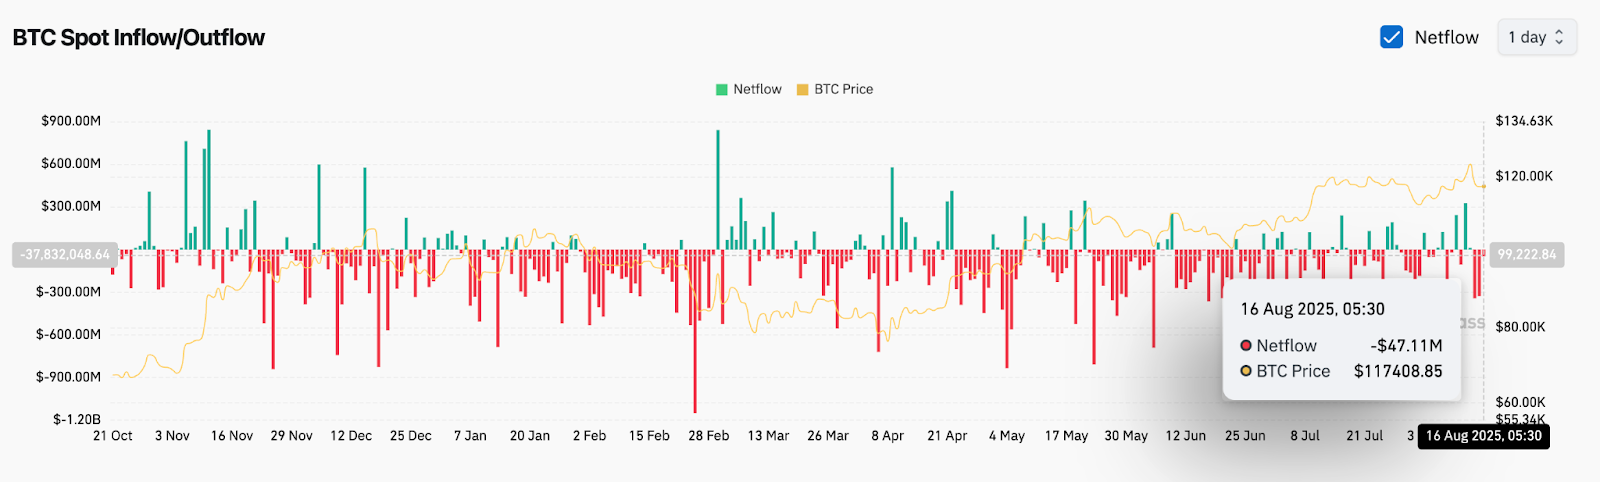 BTC Spot Inflow/Outflow Data (Source: Coinglass)
Exchange flows add weight to the downside bias. On August 16, spot netflows indicated outflows of -$47.1M, which reflect profit-taking and distribution during periods of strength. This negative trend has capped upside momentum and explains why BTC is struggling to retest the $120K level.
Technical Indicators Highlight Crucial Inflection Zone
 BTC price dynamics (Source: TradingView)
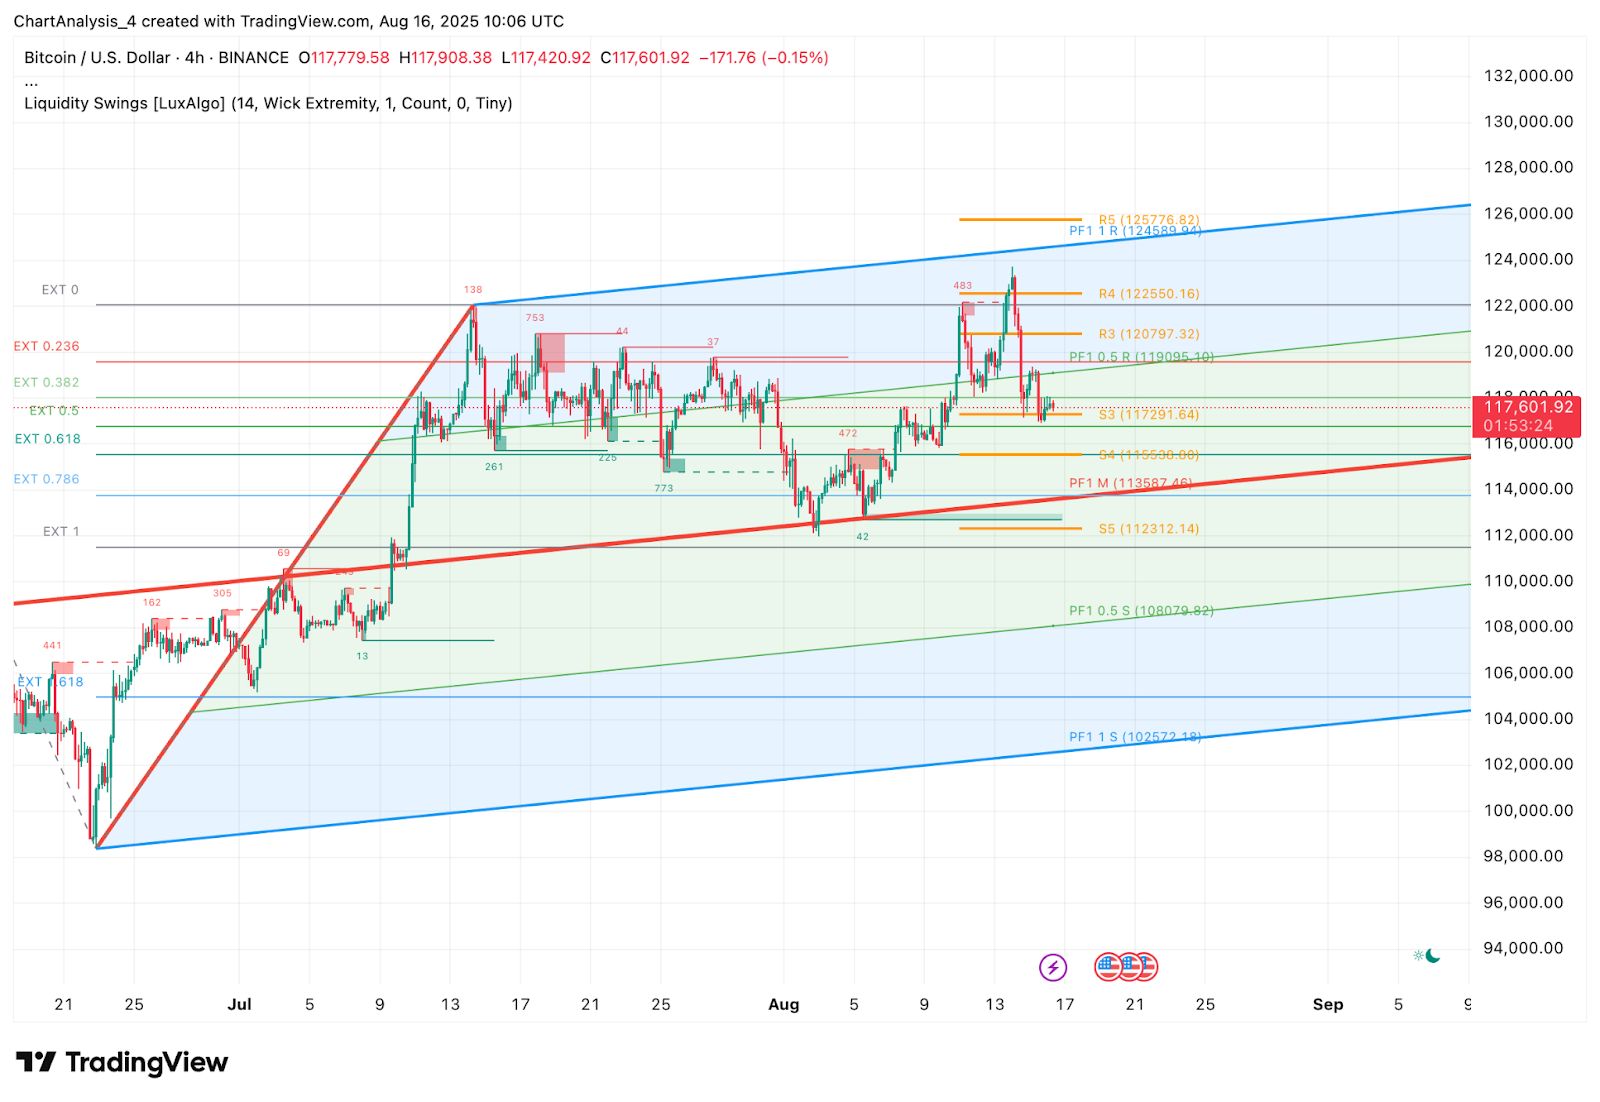
BTC’s short-term structure is defined by clustered support between $116,500 and $117,200. This band includes the 200 EMA, trendline support from July, and pivot point S3 ($117,291). Holding this region is critical to preventing further downsides.
 BTC price dynamics (Source: TradingView)
Fibonacci retracement levels mark $119,300 (0.5) and $120,800 (0.618) as key upside hurdles. If we manage to clear these hurdles, we could potentially reach $122,500 and even $124,500. Conversely, failure to defend $116,500 exposes BTC to $113,500 (PF1 monthly pivot) and the wider $112,300 support cluster.
With Bollinger Band squeeze tightening and MFI sitting at 55, the stage is set for a breakout event, likely within the next 24–48 hours.
BTC Price Prediction: Short-Term Outlook (24H)
For August 17, the near-term forecast hinges on whether BTC can stabilize above $116,500. If bulls maintain this zone, the next targets are $119,300 and $120,800, with a breakout above $122,500 signaling renewed bullish momentum toward $124,500.
On the downside, losing $116,500 risks a quick slide to $113,500, with deeper support at $112,300 and $108,700. Given the oversupply at $122K and rising selling flows, traders should watch for volume confirmation before positioning.
Bitcoin Price Forecast Table: August 17, 2025
| Indicator/Zone | Level / Signal |
| Bitcoin price today | $117,600 |
| Resistance 1 | $119,300 (Fib 0.5) |
| Resistance 2 | $120,800 / $122,500 |
| Support 1 | $116,500 (200 EMA / Pivot S3) |
| Support 2 | $113,500 / $112,300 |
| EMA Cluster (20/50/100/200) | 118,685 / 118,447 / 117,724 / 116,380 |
| Supertrend (4H) | Bearish below $121,000 |
| DMI | -DI 26.8 > +DI 24.6 (Bearish) |
| RSI (Daily) | 55.0 (Neutral) |
| TSI (Daily) | 10.2 (Flat Momentum) |
| Spot Netflow (Aug 16) | -$47.1M (Outflows) |