

Cet article ne prend pas en charge la langue que vous avez sélectionnée. Il a été automatiquement recommandé en anglais pour vous.
How to configure CTA indicators with Bitget TradingView
[Estimated reading time: 3 minutes]
This article guides you on how to configure Bitget’s CTA bot indicators using TradingView settings to visualize signals effectively.
How to Read RSI Signals?
-
When the RSI falls below 15, it may signal that the market is oversold, indicating a potential buy opportunity.
-
When the RSI rises above 75, it may signal that the market is overbought, indicating a potential sell opportunity.
These thresholds mirror how Bitget’s CTA bot identifies potential entry and exit points in the market.
How to Set up RSI bot Parameters on TradingView using Bitget CTA Settings?
Step 1: Review the CTA bot settings on Bitget
Before setting up the RSI indicator on TradingView, confirm the bot settings in the Bitget app.
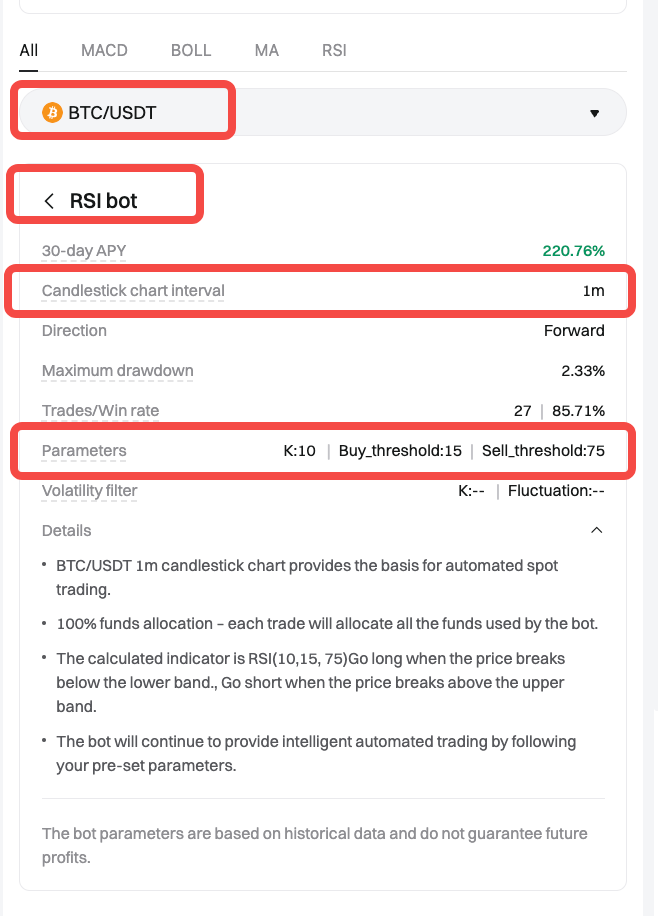
Bot configuration summary:
-
Trading pair: BTC/USDT
-
Chart interval: 1-minute (1m)
-
Bot name: RSI bot
-
Parameters:
-
K: 10
-
Buy threshold: 15
-
Sell threshold: 75
-
These values will be used to configure the RSI indicator in TradingView.
Step 2: Configure RSI indicator on TradingView
1. Open TradingView and search for BTC/USDT.
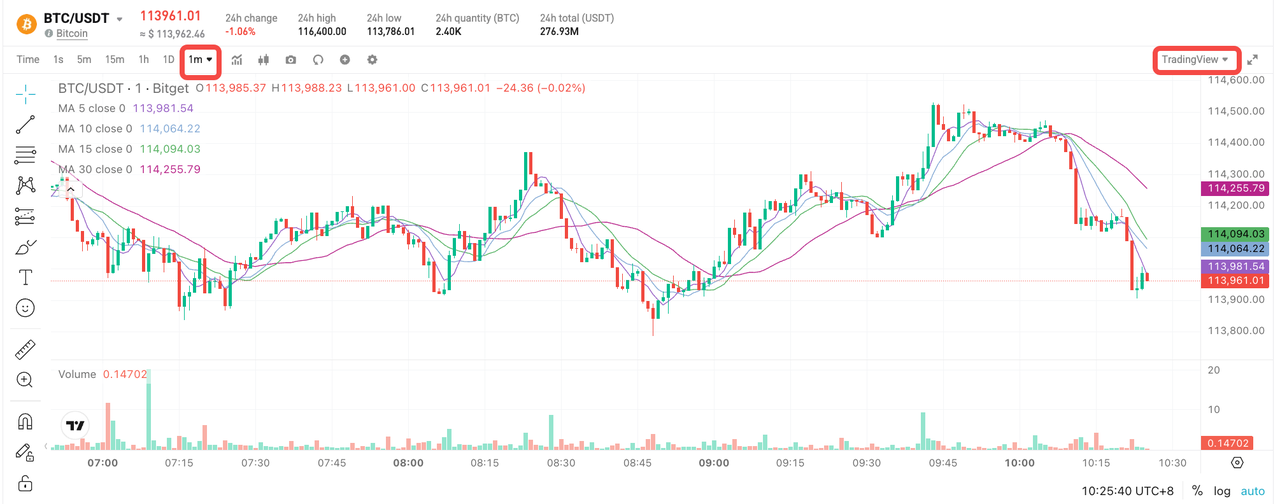
2. Set the candlestick interval to 1 minute (1m).
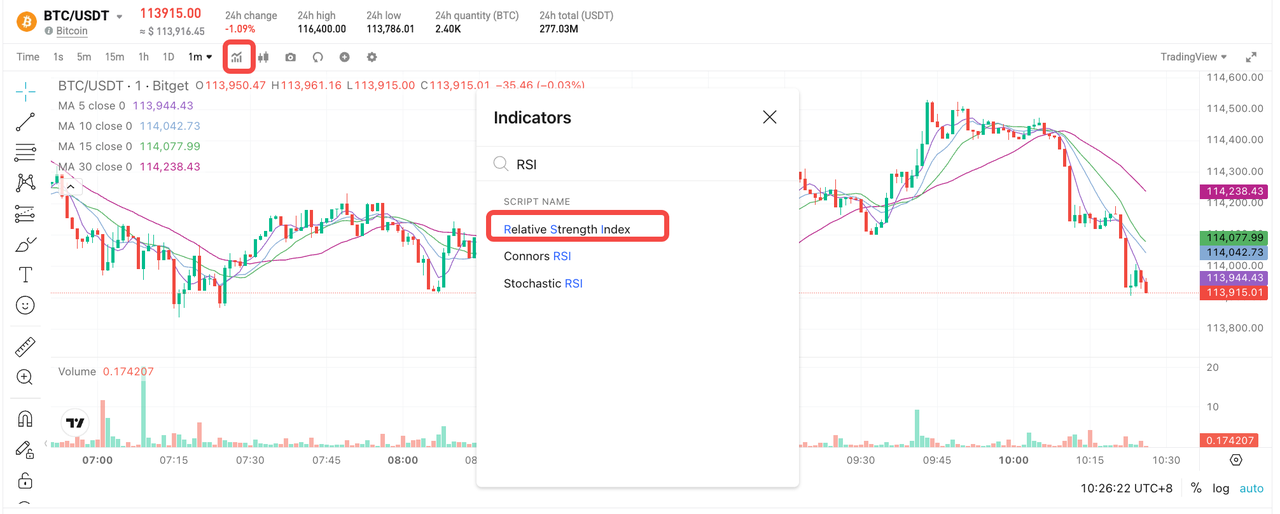
3. Click on Indicators, search for Relative Strength Index, and add it to your chart.
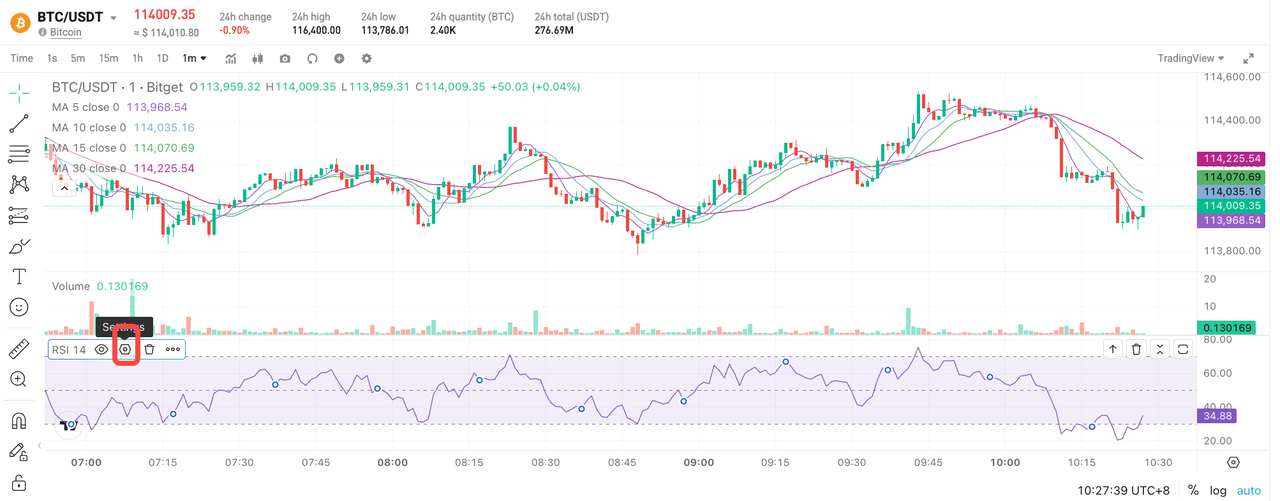
Step 3: Open RSI settings
1. Click the settings icon (gear) to open the RSI configuration panel.
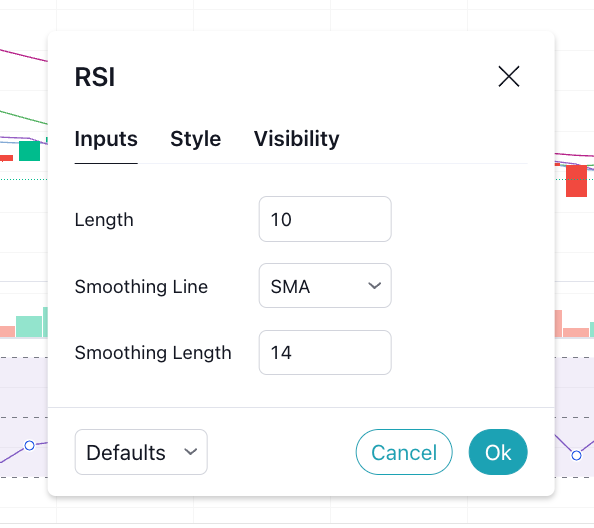
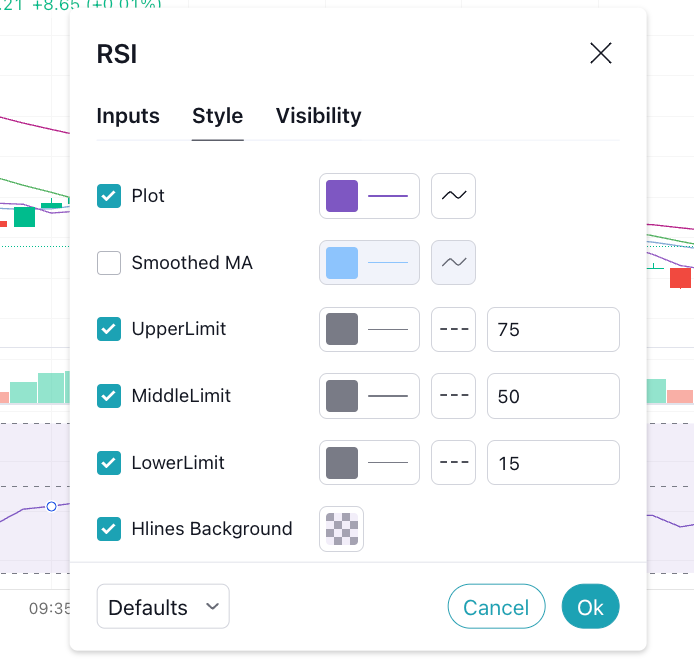
Step 4: Adjust RSI parameters
Update the input values based on your CTA bot settings:
-
Length: 10
-
Smoothing line: 14
-
Lower limit (Buy threshold): 15
-
Upper limit (Sell threshold): 75
-
Middle line: 50 (default)
Step 5: Apply changes
1. Click OK to save your RSI settings.
Important Reminder
-
Bitget CTA bots are automated trading tools, not financial advice.
-
You're responsible for reviewing and adjusting strategy settings according to your personal market outlook.
-
All trading involves risk, and past performance does not guarantee future results.
FAQs
1. What is the RSI indicator, and why is it used in trading bots?
The Relative Strength Index (RSI) is a momentum indicator that helps identify overbought or oversold market conditions. Bitget’s CTA bots use it to generate buy or sell signals.
2. Why does my TradingView RSI not match the bot’s behavior exactly?
While the visual RSI in TradingView reflects the same inputs, the CTA bot may include additional trading logic or risk filters that affect how trades are executed.
3. Can I customize the RSI parameters on TradingView?
You can change RSI parameters in TradingView. However, for accurate signal replication, use the same values configured in your CTA bot.
4. What is the smoothing line in RSI settings?
The smoothing line averages RSI movements to reduce short-term volatility. Some strategies use it to confirm trends before entering a trade.
5. Is RSI alone enough for making trading decisions?
RSI is a helpful tool but should not be used in isolation. Combine it with other indicators and risk controls for better results.
Join Bitget, the World's Leading Crypto Exchange and Web3 Company
Partager
