

Franco-Nevada
Oxirgi yangilanish: 2026-04-09 03:45 EST Aksiya narxlari haqidagi ma'lumotlar TradingView'dan olingan va real vaqt rejimidagi bozor narxlarini aks ettiradi.
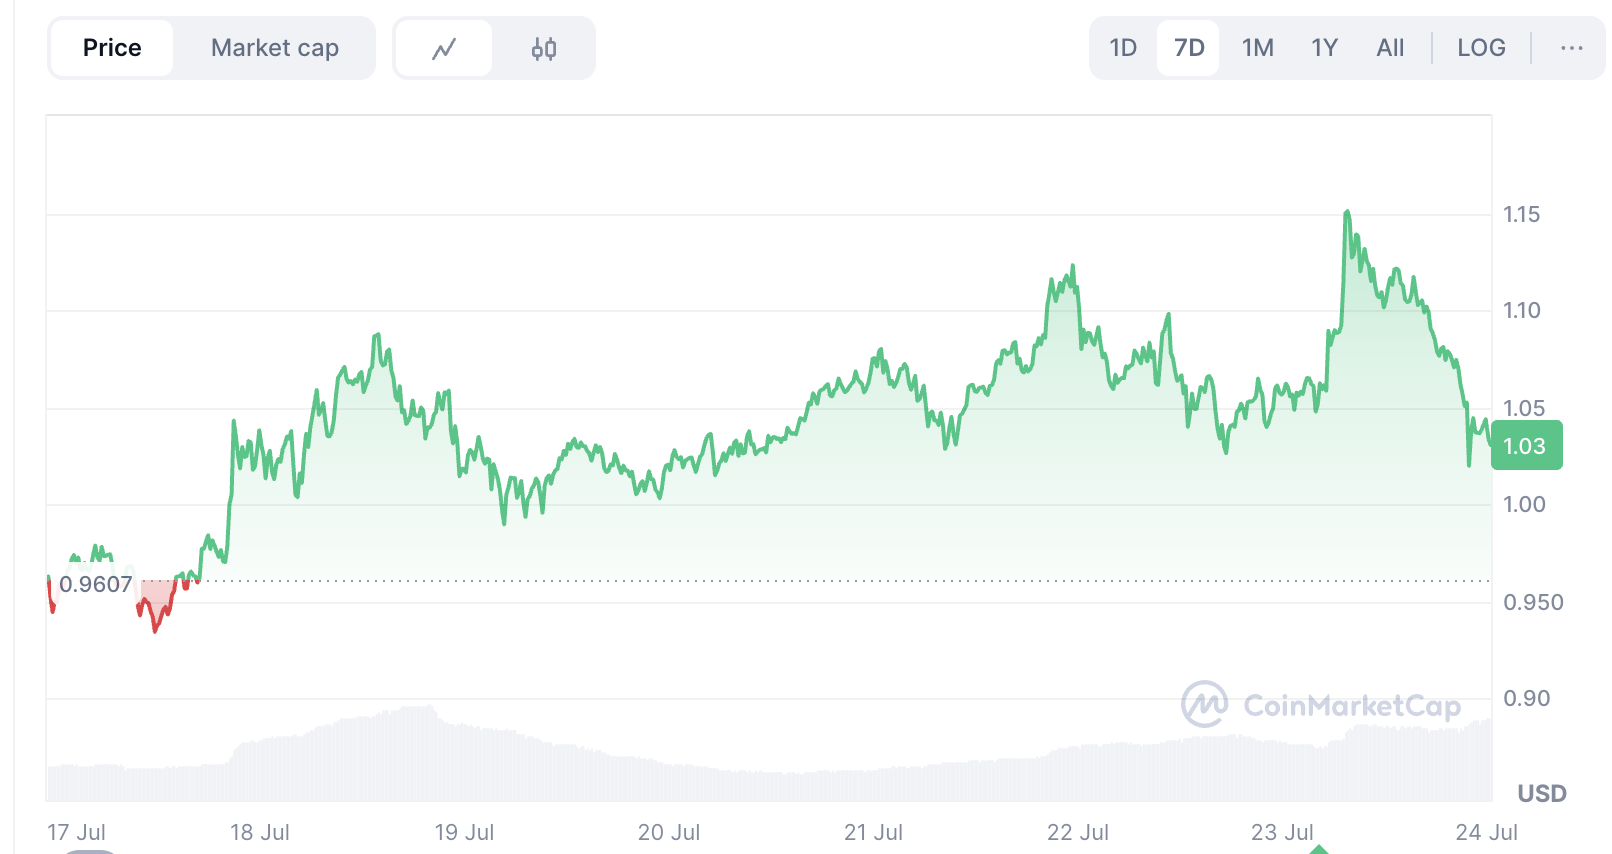
FNV aksiya narxining o'zgarishi
Trenddagi aksiyalar
Bitget haqida
FNV asosiy ma'lumotlari
Aksiya tokenlari haqida eshitganmisiz?
Aksiyalarda savdo qilishning yangi usuli – istalgan vaqtda, istalgan joyda, 24/7.
BatafsilFranco-Nevada umumiy ko'rinish
FNV impulsi
SI tomonidan yaratilgan va tahlilchilar jamoamiz tomonidan tekshirilgan FNV aksiyalari narxlari, mablag'lar oqimlari va bozor yangiliklari bo'yicha kundalik yangilanishlar. Har doim o'z tadqiqotingizni o'tkazing.
FNV aksiyalari narxi prognozi
According to technical indicators for FNV stock, the price is likely to fluctuate within the range of 403.91–498.73 CAD over the next week. Market analysts predict that the price of FNV stock will likely fluctuate within the range of 365.19–549.00 CAD over the next months.
80 ta tahlilchining 1 yillik narx prognozlariga asoslanib bildirgan fikricha, kutilayotgan eng yuqori narx 1089.27 CAD, eng past narx esa 324.98 CAD.
FNV aksiyalari haqida so'nggi yangiliklar
Global Strategic’ning 8 million dollarlik tikishi: Aqlli investitsiya harakati yoki potensial insayder xatari?
Franco-Nevada aksiyalari 1,72% oshdi, savdo hajmi 41% ga ko‘tarilib, dividend oshirilishi va institutsional xaridlar sababli 457-o‘ringa chiqdi
Franco-Nevada daromadi navbatda: Royalty modeli o‘sishni saqlab qola oladimi?
Kompaniya yangiliklari 2026-yil 12-martda
H.C. Wainwright kuchli o‘sish sababli Franco Nevada aksiyalarining narx maqsadini oshirdi
H.C. Wainwright Franco Nevada aksiyalarining narx maqsadini kuchli o‘sish sababli oshirdi
Franco-Nevada ning Cobre Panama da faoliyatini qayta boshlashi ishlab chiqarishning pasayishini oldini olishga yordam berishi va qisqa muddatli kengayishni rag‘batlantirishi mumkin
Global Strategic’ning 8 million dollarlik tikishi: Aqlli investitsiya harakati yoki potensial insayder xatari?
Franco-Nevada aksiyalari 1,72% oshdi, savdo hajmi 41% ga ko‘tarilib, dividend oshirilishi va institutsional xaridlar sababli 457-o‘ringa chiqdi
Franco-Nevada daromadi navbatda: Royalty modeli o‘sishni saqlab qola oladimi?
Kompaniya yangiliklari 2026-yil 12-martda
H.C. Wainwright kuchli o‘sish sababli Franco Nevada aksiyalarining narx maqsadini oshirdi
H.C. Wainwright Franco Nevada aksiyalarining narx maqsadini kuchli o‘sish sababli oshirdi
FNV ta raqobatchi


Aksiya sanoatidagi yangi trendlar va Bitgetning aksiya savdosidagi strategiyasi
Aksiyalarni tokenlashtirish an'anaviy moliya va kriptovalyutalar bozori kesishmasida asosiy trendlardan biriga aylanmoqda. Aksiyalar kabi aktivlarni blokcheynga o'tkazish va 24/7 global savdoni ta'minlash orqali u investorlar uchun qulaylik, samaradorlik va shaffoflikni oshiradi.
Bitget aksiyalar savdosiga platformani rivojlantirishning asosiy strategik yo'nalishi sifatida qaraydi. Hozirgi vaqtda platforma aksiya tokenlari va aksiya fyucherslari savdosini qo'llab-quvvatlaydi va allaqachon o'zini ushbu sohadagi asosiy o'yinchilardan biri sifatida ko'rsatdi.
Bitget aksiya fyucherslarining asosiy afzalliklari ularning innovatsionligi va foydalanuvchiga yo'naltirilgan dizaynida yotadi:
1. Dunyodagi birinchi: Shaffoflik va xavfsizlikni oshirish uchun bir nechta narx manbalariga bog'langan sanoatda birinchi tokenlashtirilgan fond indeksi fyucherslari.
2. Yuqori kredit yelkasi: 25x gacha kredit yelkasini qo'llab-quvvatlaydi, kapital samaradorligi va potensial daromadni maksimal darajada oshiradi.
3. Diversifikatsiyalangan asosiy aktivlar: Yuzlab mashhur aksiyalarni qamrab oladi va keng ko'lamli savdo strategiyalarini qo'llab-quvvatlaydi.
4. Tranzaksiyalar uchun past komissiyalar: komissiyalar 0.06% bilan cheklangan, bu esa tez-tez savdo qiluvchi treyderlar uchun xarajatlarni kamaytiradi.
5. Indeksni hisoblash mexanizmi: Turli emitentlarning (masalan, xStocks, Ondo) tokenlashtirilgan aktivlarining USDT narxlariga asoslangan. Vaznlar muntazam ravishda qayta hisoblanadi yoki muhim bozor hodisalari yuzaga kelganda indeks joriy bozor sharoitlariga mos kelishi uchun o'zgartiriladi.
2025-yil dekabr oyi boshiga kelib Bitget aksiya fyucherslari bozorida $18 milliarddan ortiq savdo hajmini qayd etdi, bu esa platformani aksiya tokenlari va aksiya fyucherslari savdosi bo'yicha eng ommabop platformalardan biriga aylantirdi. 2026-yil oxiriga kelib Bitget aksiya fyuchers bozoridagi jami savdo hajmi $100 milliarddan oshishi kutilmoqda.
Bitget'da savdo qilish uchun qo'llab-quvvatlanadigan aktivlar, shuningdek, Bitget aksiya tokenlari va aksiya fyucherslari haqida batafsil ma'lumot olish uchun o'qishda davom eting.
Trenddagi aksiya tokenlari


Trenddagi aksiya fyucherslari


Aksiya tokenlari va aksiya fyucherslariga oid maqolalar
Tanishtiruv
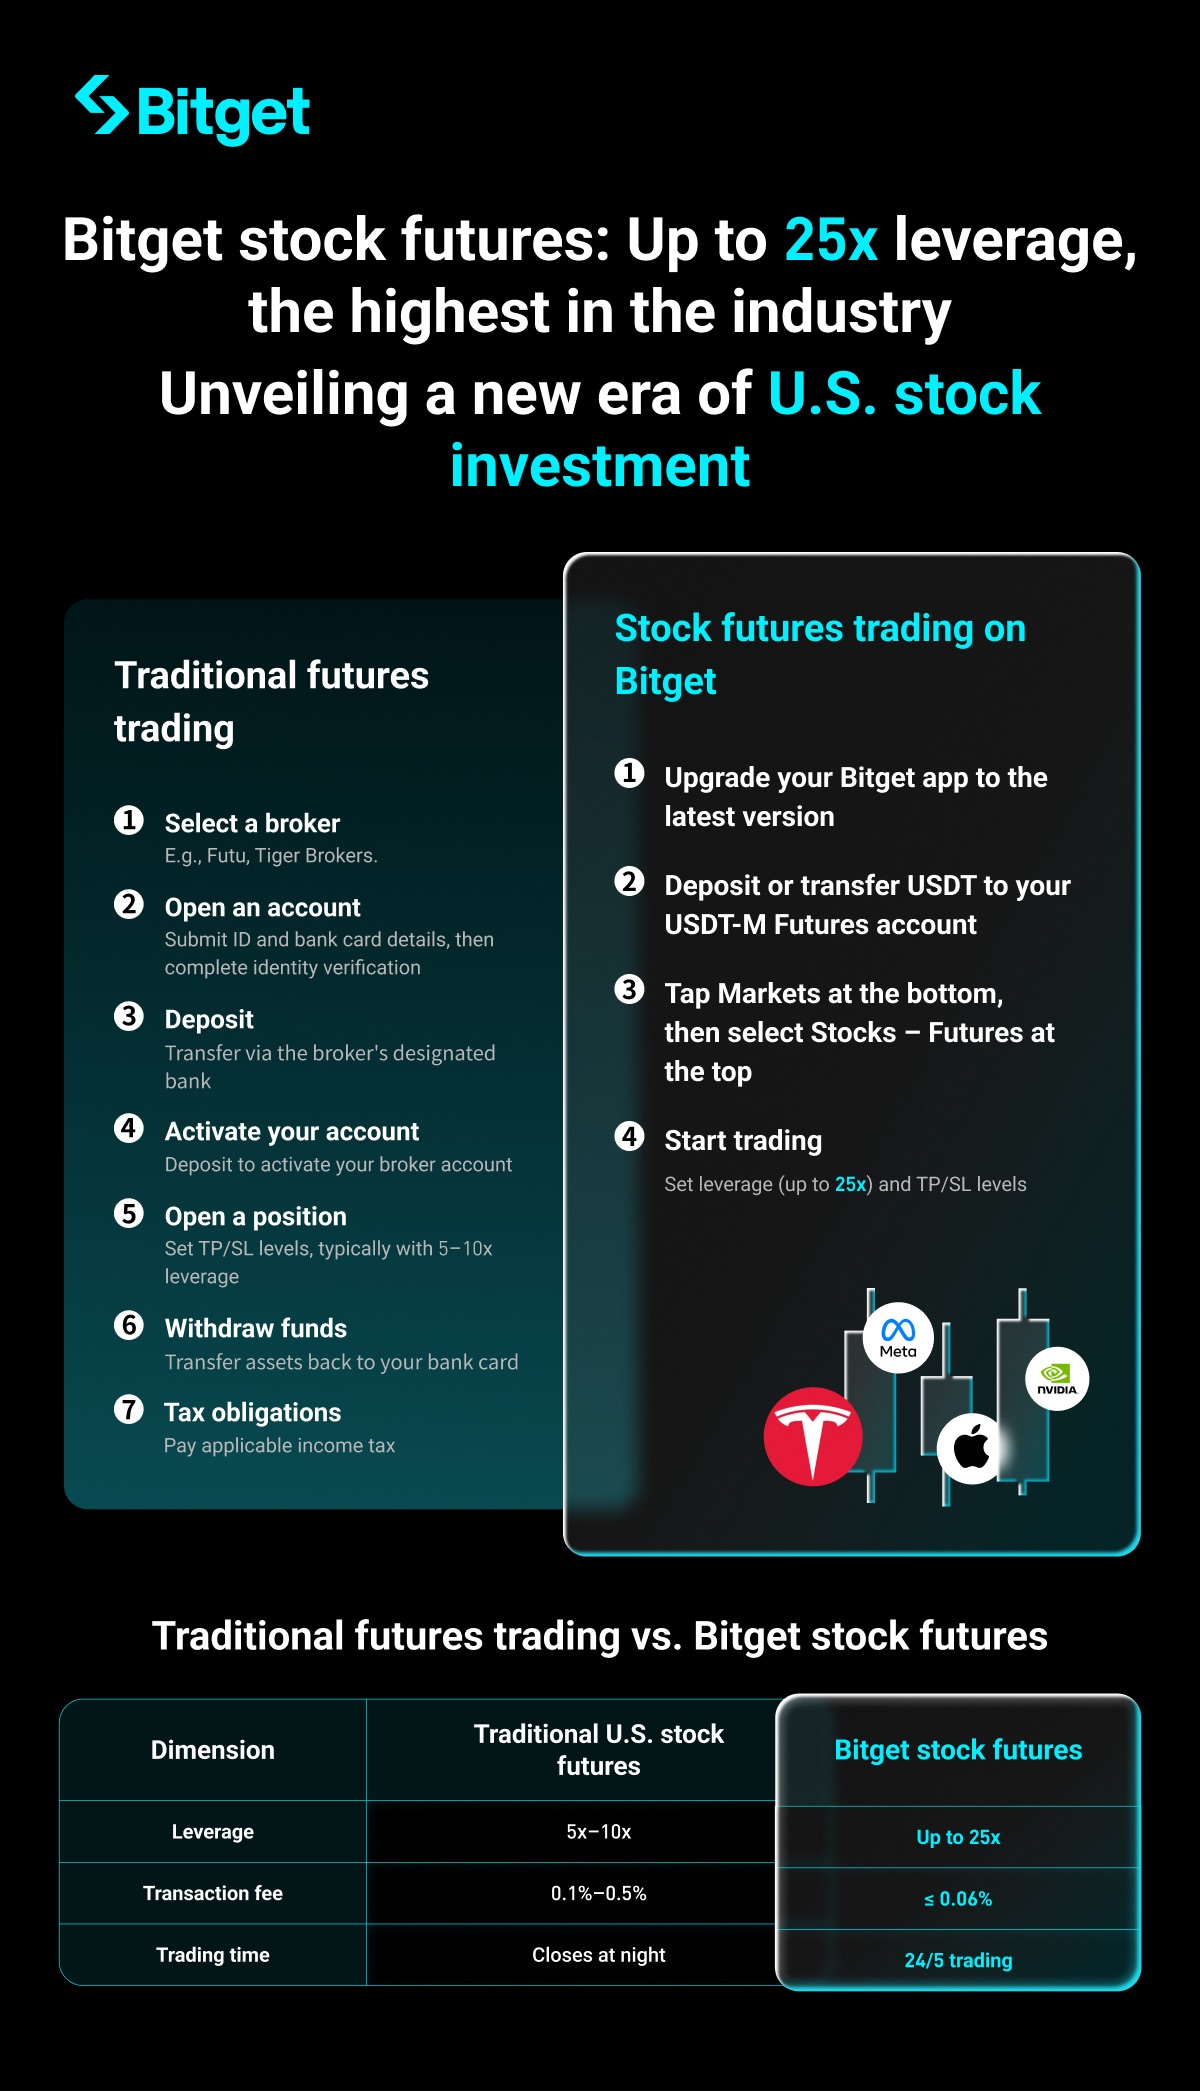
Bitget yetakchi kriptovalyuta savdo platformasi sifatida yaqinda 25 USDT-M AQSh aksiyalarining muddatsiz fyucherslarini ishga tushirdi, u o'z navbatida 25x kredit yelkasini qo'llab-quvvatlaydi. Ushbu innovatsion mahsulot foydalanuvchilarga AQSh aksiyalariga USDT orqali hisob-kitob bilan investitsiya qilish imkoniyatlaridan to'g'ridan-to'g'ri asosiy aksiyadorlik aktivlariga egalik qilmasdan foydalanish imkonini beradi. AQShning an'anaviy aksiya fyucherslari bilan solishtirganda, Bitget AQSh aksiya fyucherslari kredit yelkasi, tranzaksiya to'lovlari va savdo soatlarida aniq afzalliklarni taklif qiladi. Ushbu maqola foydalanuvchilarga tushunish va xavfsiz savdo qilishda yordam berish uchun Bitget AQSh aksiya fyucherslarining ta'rifi, xususiyatlari, qo'llab-quvvatlanadigan aktivlar, savdo qilish qo'llanmasi, risklarni boshqarish va boshqa mulohazalarni tushuntiradi.
Aksiya fyucherslari nima?
Aksiya fyucherslari Bitget tomonidan taqdim etilgan birja aktivlari uchun innovatsion muddatsiz fyuchers indeksidir. Uning asosiy aktivlari bozorda aylanayotgan tokenlashtirilgan aksiya indekslaridir. Har bir indeks kamida bitta tokenlashtirilgan aksiyani o'z ichiga oladi, ular turli emitentlardan kelishi mumkin. Bitget bozordagi savdo aksiyalari va likvidlik asosida narx shakllantirishdagi ta'sirni belgilaydi va nashr etadi. Masalan, NVDA/USDT muddatsiz fyucherslarining indeks narxi xStock, ONDO va boshqalar tomonidan chiqarilgan NVDA RWA tokenlashtirilgan aksiyalarining kompozit indeksi bo'lishi mumkin.
Bitget bozor faolligi va savdo hajmi, indeks manbalarini yangilash kabi omillar asosida tokenlar yoki savdo bozorlarini qo'shadi yoki olib tashlaydi. Bu fyuchers narxlarini yanada shaffof va barqaror qiladi. To'g'ridan-to'g'ri asosiy aksiyadorlik aktivlarini kuzatish o'rniga, ular tokenlashtirilgan aksiya bahosining o'lchovi bo'lib xizmat qiladi.
An'anaviy fyucherslar va Bitget AQSh aksiya fyucherslari
Bitget AQSh aksiya fyucherslari bir necha jihatdan an'anaviy AQSh aksiya fyucherslaridan ustun turadi. Quyida asosiy jihatlar taqqoslangan:
Bitget AQSh aksiya fyucherslari va standart USDT-M muddatsiz fyucherslari o'rtasidagi farqlar
Bitget AQSh aksiya fyucherslari standart USDT muddatsiz fyucherslaridan bir nechta farqli jihatlari mavjud. Quyida asosiy jihatlar taqqoslangan:
| Xususiyat |
Aksiya fyucherslari |
Muddatsiz USDT muddatsiz fyucherslari |
| Savdo davri |
24/5 (UZT: dushanba soat 09:00 dan shanba kuni soat 09:00 gacha). Ehtimoliy to'xtatib turish to'g'risida oldindan e'lon qilinadi.
|
24/7 |
| Hisob-kitob valyutasi |
USDT |
USDT |
| Kotirovka valyutasi |
USDT |
USDT |
| Asosiy aktiv |
Bir nechta platformalarda chiqarilgan tokenlashtirilgan aktivlarning kompozit indeksi (ko'p tokenli indeks) |
Yagona belgilangan token |
| Pozitsiya rejimi |
Faqat izolyatsiyalangan marja rejimi |
Izolyatsiyalangan marja, kross marja va yagona savdo hisobi |
| Maksimal kredit yelkasi |
25x |
125x |
| Indeks narxi |
xStock va ONDO kabi bozorlardagi tokenlar narxlarining kompozit indeksi |
Belgilangan tokenning spot bozor narxi |
| Markirovka narxi |
Standart usul |
Standart usul |
| Ochiq foiz (OI) chegaralari |
Ham individual, ham platforma miqyosida OI chegaralari qo'llaniladi |
Faqat individual OI chegaralari |
| Moliyalashtirish oralig'i |
4 soat |
Har 1S, 2S, 4S yoki 8S |
Bitget AQSh aksiya fyucherslarining afzalliklari
Bitget AQSh aksiya fyucherslarining asosiy afzalliklari ularning innovatsion yechim ekanligi va qulay dizaynidadir:
1. Dunyoda birinchi bo'lib: Shaffoflik va xavfsizlikni oshirish uchun bir nechta narx manbalariga asoslangan kripto sanoatida birinchi bo'lib chiqarilgan tokenlashtirilgan aksiya indeksi fyucherslari.
2. Yuqori kredit yelkasi: Potensial foydani ko'paytirish va kapital samaradorligini oshirish uchun 25x gacha kredit yelkasini qo'llab-quvvatlaydi.
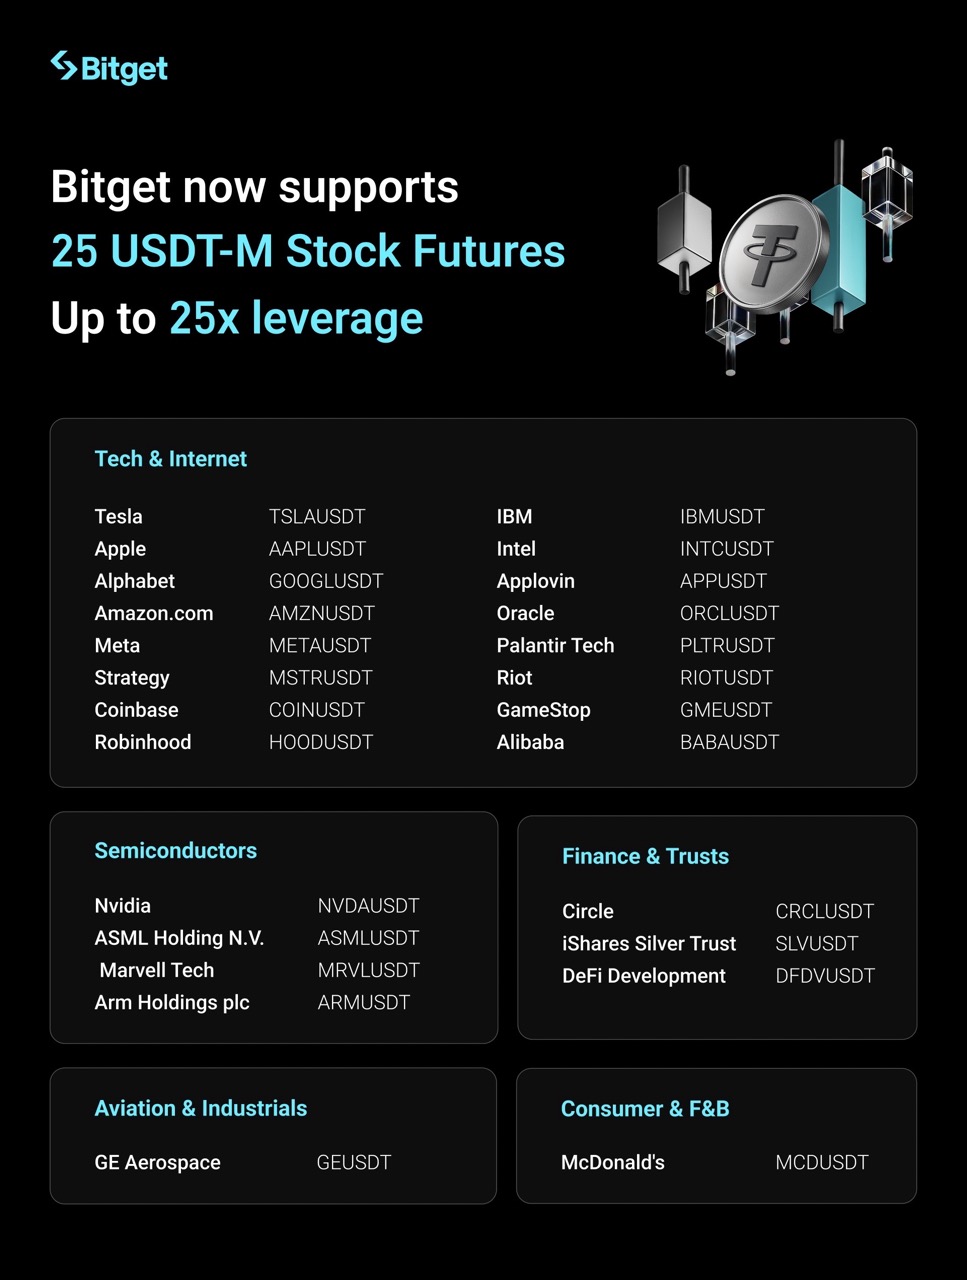
3. Diversifikatsiyalangan asosiy aktivlar: Turli savdo strategiyalarini qo'llab-quvvatlash uchun 20 dan ortiq mashhur AQSh aksiyalarini qamrab oladi.
4. Kam tranzaksiya komissiyasi: Tranzaksiya komissiyasi stavkasi 0,06% dan oshmaydi, ko'p savdo qiluvchi treyderlar uchun xarajatlarni kamaytiradi.
5. Indeksni hisoblash: Turli emitentlar (masalan, xStock, ONDO) tokenlashtirilgan aktivlarining USDT narxlariga asoslanib, vaznlar muntazam ravishda yoki har doim muhim voqealar sodir bo'lganda qayta hisoblab chiqiladi, bu indeks bozor o'zgarishlariga mos kelishini ta'minlaydi.
Indeksni muvozanatlash
● Muntazam qayta muvozanatlash: Indeks komponentlari va ularning indeks narxiga ta'siri har kuni soat 13:01:00 da (UZT) qayta hisoblab chiqiladi.
● Maxsus sozlash: Agar komponentlar sezilarli o'zgarishlarga duch kelsa (masalan, delisting, likvidlik yetishmasligi yoki kuchli o'zgaruvchanlik), ular olib tashlanadi, narx shakllantirishga ta'sir darajasi qayta hisoblab chiqiladi va uning o'rnini bosuvchi komponent ishlatiladi.
● Xard-fork/airdrop/sozlashlar: Yangi tokenlar yaratmaydigan forklar uchun hech qanday tuzatish talab qilinmaydi. Agar yangi tokenlar yaratilsa, ular asl vaznga qo'shiladi. Agar ular mezonlarga javob bermasa, ular keyingi qayta muvozanatlash vaqtida olib tashlanadi. Tokenning bo'linishi yoki birlashishi uchun asl komponent yangi token bilan almashtiriladi va og'irlik mos ravishda o'rnatiladi.
Bitgetda qo'llab-quvvatlanadigan AQSh aksiya fyucherslari tafsilotlari
Bitget hozirda kompaniyalar bo'yicha guruhlangan 25 ta trenddagi USDT-M muddatsiz fyucherslarini qo'llab-quvvatlaydi:
Bitgetda AQSh aksiya fyucherslarini qanday savdo qilsam bo'ladi?
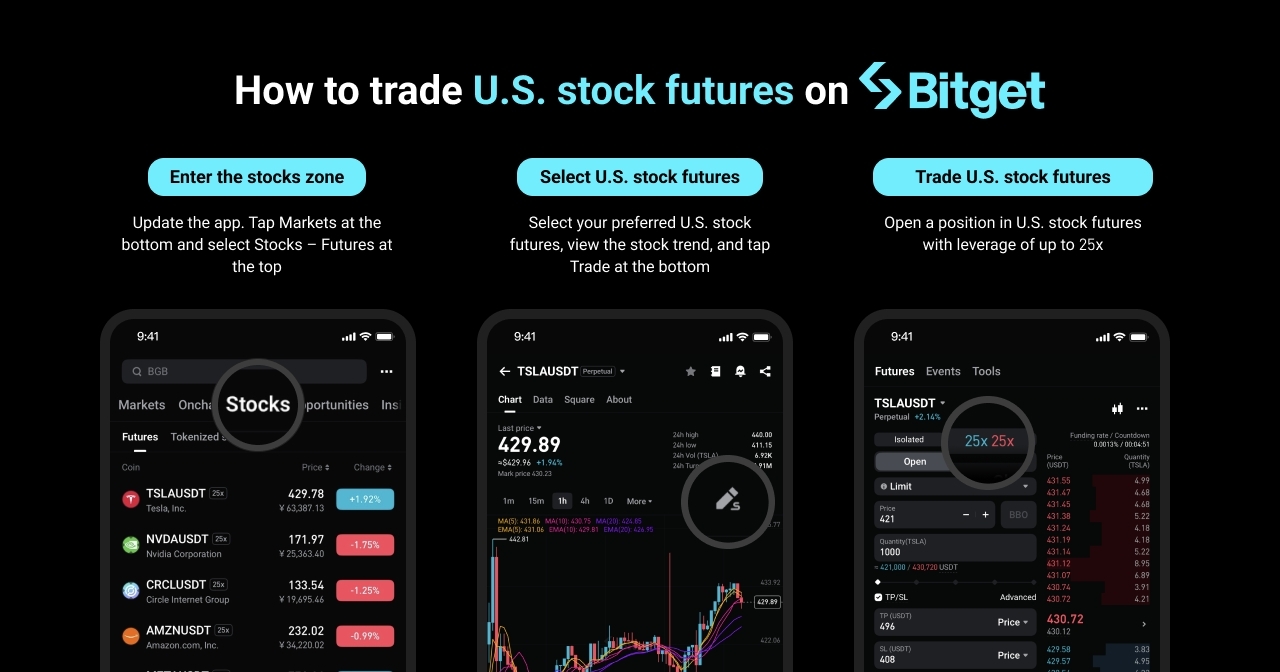
1. Ilovani yangilang: Bitget ilovasining oxirgi versiyasidan foydalanayotganingizga ishonch hosil qiling yoki rasmiy veb-saytga tashrif buyuring.
2. Depozit/o'tkazma: USDTni USDT-M futureslari hisobingizga depozit qiling yoki o'tkazing.
3. Savdo sahifasini kiring: Pastki qismdagi Bozorlarga bosing, so'ng yuqoridagi Aksiyalar – Fyuchersni tanlang. Tiker bo'yicha qidiring yoki aksiya toifalari ostidan qidirib toping.
4. Savdoni boshlash: Kredit yelkasi (25x gacha), TP/SL va boshqalarni o'rnating. Veb, ilova va API savdolari qo'llab-quvvatlanadi, lekin birlashtirilgan savdo hisobi rejimi mavjud emas. Siz yagona aktiv rejimiga o'tishingiz kerak.
5. Savdoni to'xtatib turish vaqtida: Mavjud buyurtmalarni bekor qilishingiz mumkin, lekin yangi buyurtma joylashtira olmaysiz. Moliyaviy to'lovlar hisoblanmaydi; markirovka narxi yangilanmaydi va pozitsiyalar tugatilmaydi.
Savdo soatlari va bayramlar
● Odatiy savdo soatlari: Haftasiga besh kun, kuniga 24 soat, dushanba kuni 01:00 dan shanba kuni 01:00 gacha (UZT) mavjud.
● To'xtatib turish: Moliya bozorlari yopilgan dam olish kunlarida savdolar to'xtatiladi. 2025-yil uchun asosiy yopilish sanalari quyidagilar:
| Sana |
Hafta |
Bayram nomi |
Savdo jadvali |
| 1-yanvar 2025-yil |
Chorshanba |
Yangi Yil kuni |
Kun bo'yi yopiq |
| 20-yanvar 2025-yil |
Dushanba |
Kichik Martin Lyuter King kuni Kun |
Kun bo'yi yopiq |
| 17-fevral 2025-yil |
Dushanba |
Prezident kuni |
Kun bo'yi yopiq |
| 18-aprel 2025-yil |
Juma |
Xayrli juma |
Kun bo'yi yopiq |
| 26-may 2025-yil |
Dushanba |
Xotira kuni |
Kun bo'yi yopiq |
| 19-iyun 2025-yil |
Payshanba |
Qullarni ozod qilish kuni |
Kun bo'yi yopiq |
| 4-iyul 2025-yil |
Juma |
Mustaqillik kuni |
Kun bo'yi yopiq |
| 1-sentabr, 2025-yil |
Dushanba |
Mehnat kuni |
Kun bo'yi yopiq |
| 27-noyabr 2025-yil |
Payshanba |
Shukronalik kuni |
Kun bo'yi yopiq |
| 25-dekabr 2025-yil |
Payshanba |
Rojdestvo |
Kun bo'yi yopiq |
● Vaqtli yopilish: Bozor 2025-yil 2-iyul (Mustaqillik kunidan bir kun oldin), 2025-yil 27-noyabr (Shukronalik kunidan keyin) va 2025-yil 23-dekabr (Rojdestvo bayramidan bir kun oldin) soat 22:00 da (UZT) vaqtliroq yopiladi.
● Eslatma: Ochilish narxi oldingi kunning yopilish narxidan sezilarli darajada farq qilishi mumkin. Iltimos, bir kechasi pozitsiyalarni egallab turgan bo'lsangiz, xavflarni baholang.
Xatarlarni boshqarish va eslatmalar
Likvidatsiya mexanizmi
● Odatiy izolatsiyalangan marja fyucherslariga o'xshab, xavf likvidatsiya narxi yoki pozitsiya marjasi nisbati bilan belgilanadi.
● To'xtatib turish vaqtida pozitsiyalar tugatilmaydi. Biroq, agar savdo qayta boshlanganidan keyin narx bo'shlig'i mavjud bo'lsa, bu likvidatsiyaga olib kelishi mumkin. Bozor ochilishidan oldin qo'shimcha marja qo'shish tavsiya etiladi.
Sug'urta fondi
● ADL har bir fyuchers savdo juftligi uchun sukut bo'yicha yoqilgan bo'lib, dastlabki xavf fondi sifatida 50,000 USDT kiritiladi.
● ADL trigger: Sug'urta fondi kapitali 0 ga tushganda ishga tushiriladi.
Xavf haqida umumiy ogohlantirish
AQSh aksiyalar muddatsiz fyucherslari yuqori volatillikka duch kelishi mumkin. Yuqori kredit yelkasi bilan savdo qilish risklaringizni sezilarli darajada oshirishi mumkin. O'z pozitsiyalaringizni ehtiyotkorlik bilan boshqaring.
● Ushbu mahsulot qimmatli qog'oz emas va asosiy aksiyaga egalik huquqini bildirmaydi. Dividendlar, foizlar yoki ovoz berish huquqini bermaydi.
● Davlat sug'urtasi yoki kafolatlari bilan qamrab olinmaydi. Bitget emitent yoki distribyutor emas.
● Raqamli aktivlar juda o'zgaruvchan. Faqat yo'qotishingiz mumkin bo'lgan narsaga sarmoya kiritish tavsiya etiladi. Oldingi ko'rsatkichlar kelajakdagi natijalarni kafolatlamaydi. Bitget hech qanday yo'qotishlar uchun javobgar emas.
● Har doim mustaqil moliyaviy maslahat olishingiz va Bitget Foydalanish shartlari va Shartnoma Xizmati shartnomasi asosida qaror qabul qilishingiz kerak.
Bitget bozor sharoitlariga qarab kredit yelkasi va marja nisbati kabi parametrlarni sozlashi mumkin. Oxirgi rasmiy e'lonlarga qarang.
Bitget professional va xavfsiz savdo xizmatlarini taqdim etish uchun mahsulotlarni yaxshilashni davom ettiradi. Qo'shimcha yordam olish uchun Bitget yordam markaziga tashrif buyuring yoki mijozlarni qo'llab-quvvatlash xizmati bilan bog'laning. Qo'llab-quvvatlaganingiz uchun tashakkur!
Xavf haqida ogohlantirish:
Aksiya tokenlari ("Mahsulot") bozorda allaqachon muomalada bo'lgan tokenlashtirilgan aksiya indekslari savatiga asoslanadi. Biroq, Mahsulot qimmatli qog'oz emas va asosiy aksiyalarga yoki tegishli aksiya tokenlari yoki indekslariga haqiqiy egalik huquqini bildirmaydi. Mahsulot sizga dividend, foiz, ovoz berish huquqi, aksiyador imtiyozlari yoki har qanday asosiy aksiyalar yoki tegishli aksiya tokenlari yoki indekslari (jumladan, lekin ular bilan cheklanmagan holda baham ko'rish, ayirboshlash yoki obuna huquqlarini) bo'yicha sotib olish huquqini bermaydi. Mahsulot hech qanday davlat yoki agentlik tomonidan qo'llab-quvvatlanmaydi, sug'urtalanmagan, tasdiqlanmagan yoki kafolatlanmagan. Bitget asosiy aksiya, tegishli aksiya tokenlari yoki indekslarining emitenti ham, distribyutori ham emas.
Raqamli aktivlar narxi juda o'zgaruvchan va sezilarli tebranishlarga duch kelishi mumkin. Investorlar faqat yo'qotishga qodir bo'lgan mablag'larni investitsiya qilishlari kerak. Sizning sarmoyangiz qiymati o'zgarishi mumkin va moliyaviy maqsadlarga erishish yoki asosiy kapitalingizni qoplash kafolati yo'q. Investorlarga mustaqil moliyaviy maslahat olish va o'zlarining moliyaviy tajribasi va sharoitlarini sinchkovlik bilan baholash tavsiya etiladi. Oldingi ko'rsatkichlar kelajakdagi natijalarni kafolatlamaydi. Bitget har qanday mumkin bo'lgan yo'qotishlar uchun javobgarlikni o'z zimmasiga olmaydi. Ushbu maqoladagi hech narsa moliyaviy maslahat sifatida talqin qilinmasligi kerak. Qo'shimcha ma'lumot olish uchun bizning Foydalanish shartlari va Fyuchers xizmati shartnomasiga qarang.
Plume (PLUME) nima?
Plume (PLUME) modulli, xavfsiz va kengaytiriladigan blokcheyn infratuzilmasi bo'lib, u tokenizatsiya va real aktivlarni (RWA) boshqarishga qaratilgan. Tokenizatsiya moddiy yoki nomoddiy aktivlarni, masalan, ko'chmas mulk, tovarlar yoki hatto intellektual mulkni savdo qilish, garovga qo'yish yoki turli xil blokcheyn ilovalarida foydalanish mumkin bo'lgan raqamli tokenlarga aylantirishni o'z ichiga oladi.
Plume - bu muvofiqlik va ma'lumotlar integratsiyasidan tortib savdo va likvidlik yechimlarigacha bo'lgan RWA moliyasi (RWAfi) uchun zarur bo'lgan hamma narsani ta'minlaydigan ekotizim. Xavfsizlik, shaffoflik va qulaylik bilan bog'liq muammolarni hal qilish orqali Plume blokcheyndagi RWAlarning to'liq salohiyatini ochishga intiladi.
Plume (PLUME) ni kim yaratgan?
Plume jamoasi Coinbase, Robinhood, Binance, Galaxy Digital va LayerZero kabi yetakchi firmalarning yetakchilaridan tuzilgan bo'lib, real dunyo aktivlarini tokenizatsiya qilishda inqilob qilish uchun tengsiz tajriba olib keladi.
Chris Yin, bosh direktor, Scale Venture Partners va Rainforest QA kompaniyasida mahsulot va strategiyani boshqargan va Coupa tomonidan sotib olingan Xpenserga asos solgan.
Teddy Pornprinya, bosh biznes direktori, Binance, Coinbase Ventures va Daiwa Securities kompaniyalaridan tajriba olib keladi.
Eugene Shen, CTO, dYdX va Robinhood Cryptoda yechimlar ishlab chiqdi.
Marketingni avval Binance va Plug and Play kompaniyalaridan bo'lgan Tiffani Lung boshqaradi, Jason Meng va Ivy Kang esa LayerZero, Galaxy Digital va JP Morgan kompaniyalarida tajribaga ega bo'lgan biznesni rivojlantirishga yordam beradi.
Viktor Ernandes Binance va Bitsodagi rollarga tayanib, jamiyatdagi sa'y-harakatlarni boshqaradi, Alex Palmer esa tadbirkorlik tajribasidan foydalangan holda mahsulot sohasida innovatsiyalar kiritadi.
Qaysi venchur fondlar Plume (PLUME) ni qo'llab-quvvatlaydi?
Plume rivojlanishini qo'llab-quvvatlash - bu dunyodagi eng mashhur venchur kapital firmalarining mustahkam tarmog'idir. Bularga Brevan Xovard, Haun Ventures, Galaxy Digital, Lightspeed Action, Superscrypt, HashKey Capital, Laser Digital (Nomura Group), Selini Capital, 280 Capital, a_capital, SVA va Portal Ventures kiradi.
Plume (PLUME) qanday ishlaydi
Asosiy komponentlar
Plume - bu real aktivlarni tokenizatsiya qilishni soddalashtirish uchun qurilgan modulli, xavfsiz va kengaytiriladigan infratuzilma. U uchta asosiy komponentni birlashtiradi: Arc, Smart Wallets va Nexus. Birgalikda ushbu elementlar muvofiqlikni ta'minlaydigan, uzluksiz savdoni osonlashtiradigan va blokcheyndagi real dunyo ma'lumotlarini birlashtiradigan mustahkam asosni tashkil qiladi.
1. Arc: Tokenizatsiya mexanizmi
Arc - bu Plumening aktivlarni tokenlash uchun mo'ljallangan dvigateli bo'lib, tokenlashtirilgan RWAlarni yaratish, bortga joylashtirish va boshqarishni osonlashtiradi. Aktiv jismoniy (ko'chmas mulk yoki tovarlar kabi) yoki raqamli (masalan, hisob-fakturalar yoki intellektual mulk) bo'ladimi, Arc jarayonning samarali, xavfsiz va muvofiqligini ta'minlaydi.
Arc tartibga solish moslashuvi va aniqligini ta'minlash uchun muvofiqlik va ma'lumotlar tizimlari bilan integratsiyalashgan. Tokenizatsiya bilan bog'liq an'anaviy qo'lda bajariladigan ko'plab qadamlarni avtomatlashtirish orqali u emitentlarga aktivlarni tez va arzon narxda tokenizatsiya qilish imkonini beradi.
Arc ayniqsa qimmatlidir, chunki u ko'pincha qimmat va murakkab bo'lgan jarayonni soddalashtiradi. Arc bilan emitentlar o'z aktivlarining qiymatiga e'tibor berishlari mumkin, balki ularni onchainni olib kelishning texnik jihatlariga emas.
2. Aqlli hamyonlar: Aktivlarni boshqarishni qayta aniqlash
Plume's Smart Wallets foydalanuvchilarga o'zlarining tokenlashtirilgan aktivlari ustidan ko'proq nazorat qilish uchun mo'ljallangan. Ko'pincha asosiy tranzaksiyalar bilan cheklangan an'anaviy hamyonlardan farqli o'laroq, Smart Wallets steyking, garov va markazlashtirilmagan moliya (DeFi) protokollari bilan integratsiya kabi ilg'or xususiyatlarni taklif etadi.
Ushbu hamyonlar saqlash va muvofiqlik xususiyatlarini to'g'ridan-to'g'ri o'z arxitekturasiga kiritadi. Bu shuni anglatadiki, foydalanuvchilar o'z aktivlarini xavfsiz boshqarishi va tartibga solish talablarini osonlikcha boshqarishi mumkin. Hamyon interfeysi foydalanuvchilar uchun qulay bo'lib, undan turli darajadagi blokcheyn tajribasiga ega odamlar foydalanishi mumkin.
Aksariyat real aktivlar xoldinglari bugungi kunda turg'un holatda - ular DeFi ekotizimlari bilan osongina o'zaro aloqa qila olmaydi. Plume's Smart Wallets bu muammoni daromad olish, kredit bozorlarida ishtirok etish va likvidlikni boshqarish kabi yangi imkoniyatlarni ochish orqali hal qiladi.
3. Nexus: Ma'lumotlar magistrali
Nexus blokcheyn va real dunyo o'rtasidagi ko'prikdir. U prognoz bozorlari, kreditlash protokollari va aktivlarni baholash kabi sohalarda tokenlashtirilgan aktivlardan yangi foydalanish holatlarini ta'minlaydigan offchain ma'lumotlarini olib keladi.
Nexus ishonchli tashqi manbalardan olingan ma'lumotlarni birlashtiradi va real vaqt rejimida to'g'ridan-to'g'ri blokcheynga ma'lumot beradi. Bu foydalanuvchilarga moliyaviy qarorlar qabul qilishda aniq, amalda bo'ladigan ma'lumotlarga ega bo'lishini ta'minlaydi.
Ma'lumotlar har qanday moliyaviy tizimning asosidir. Nexus yordamida Plume foydalanuvchilarga savdo, kreditlash yoki boshqa DeFi ilovalari uchun tokenlashtirilgan aktivlar bilan samarali ishlash uchun zarur bo'lgan ma'lumotlarga ega bo'lishini ta'minlaydi.
Plumeni ajratib turadigan asosiy xususiyatlar
Arxitekturasidan tashqari, Plume o'zining qiymat taklifini yaxshilaydigan bir qator xususiyatlarni taklif etadi:
1. O'rnatilgan AML muvofiqligi
Plume pul yuvishga qarshi tekshiruvlarni (AML) to'g'ridan-to'g'ri o'z platformasiga birlashtirib, barcha tranzaksiyalar tartibga soluvchi standartlarga javob berishini ta'minlaydi. Bu foydalanuvchini ishga tushirishni osonlashtiradi va tizimga ishonchni oshiradi.
2. Likvidlik va savdoni qo'llab-quvvatlash
Likvidlik har qanday moliyaviy tizim uchun juda muhimdir. Plume ishonchli provayderlar bilan hamkorlik qilish va steyking, yuqori hosildorlik va DeFi integratsiyasi kabi xususiyatlarni yoqish orqali tokenlashtirilgan aktivlar uchun likvidlikni oshiradi. Bu siljishni kamaytiradi va aktivlar narxini barqarorlashtiradi, bu esa ekotizimni yanada mustahkam qiladi.
3. Ma'lumotlar integratsiyasi va tahlili
Nexus orqali Plume real vaqt rejimida foydalanuvchilarga ongli qarorlar qabul qilish imkonini beruvchi ma'lumotlar tasmasi taqdim etadi. Siz qarz beruvchi, qarz oluvchi yoki treyder bo'lasizmi, bu ma'lumotlar sizga RWA bozorida muvaffaqiyat qozonish uchun zarur bo'lgan ma'lumotlarga ega bo'lishingizni ta'minlaydi.
Plume USD
Plume ekotizimiga RWA moliyasi doirasida xavfsiz to'lovlar, savdo va garovni qo'llab-quvvatlash uchun mo'ljallangan Plume USD stabilkoin kiradi. To'liq qo'llab-quvvatlangan va AQSH dollari bilan 1:1 nisbatini saqlab turgan holda, Plume USD chuqur likvid va zarb qilish oson. Foydalanuvchilar USDC va USDT kabi ommabop stabilkoinlarni Plume USDni zarb qilish uchun depozit qilishlari mumkin, keyinchalik ularni platformadagi turli xil DeFi dasturlarida ishlatish mumkin.
Kelajakda Plume USD xolderlari uning foydaliligini yanada oshiradigan eksklyuziv rentabellik imkoniyatlariga ega bo'ladilar.
Xavfsizlik va oshkoralik
Plume xavfsizlikni birinchi o'ringa qo'yadi, platformasi xavfsiz va ishonchli bo'lishini ta'minlash uchun muntazam ravishda uchinchi tomon auditlarini o'tkazadi. Tugallangan auditlar qatoriga uning blokcheyn infratuzilmasi (Arbitrumning ArbOS, Nitro va Stylus texnologiyalari asosida),kross-chain ko'priklar va Smart Wallets sharhlari kiradi.
Doimiy xavfsizlik choralariga quyidagilar kiradi:
● Doimiy monitoring: Real vaqt rejimida noodatiy faoliyatni aniqlash va ularga javob berish.
● Muntazam kodlarni ko'rib chiqish: Eng yuqori xavfsizlik standartlariga rioya qilishni ta'minlash.
● Shaffoflik: Plume o'z audit hisobotlarini ochiqchasiga baham ko'radi va foydalanuvchilari orasida ishonchni kuchaytiradi.
PLUME Bitgetda mavjud bo'ladi
Bitgetda Plumening mahalliy tokeni bo'lgan PLUME savdosi zamonaviy markazlashtirilmagan ekotizimda ishtirok etish uchun strategik imkoniyatni taqdim etadi. Plume o'zining Plume Arc, Plume Smart Wallet va Plume Nexus kabi innovatsion xususiyatlari bilan qiziqishni kuchaytirishda davom etar ekan, ushbu o'sib borayotgan tarmoq ichidagi tokenning yordam dasturi kengayishi kutilmoqda.
Bitgetda PLUME bilan savdo qiling!
Mas'uliyatni rad etish: Ushbu maqolada keltirilgan fikrlar faqat ma'lumot uchun mo'ljallangan. Ushbu maqola muhokama qilingan mahsulot va xizmatlar yoki investitsiya, moliyaviy yoki savdo maslahatlarini tasdiqlamaydi. Moliyaviy qarorlar qabul qilishdan oldin malakali mutaxassislar bilan maslahatlashish kerak.
Xavf haqida ogohlantirish
Bitget hisobi bilan siz bir vaqtning o'zida aksiyalar va kriptovalyutalar bilan savdo qilishingiz mumkin.
Hoziroq qo'shilish!Tez-tez beriladigan savollar
Franco-Nevada aksiya narxi qancha?
Franco-Nevada aksiya tikeri nima?
FNV aksiya prognozi qancha?
Franco-Nevada bozor qiymati qancha?
P/E nisbati (TTM) nima?
P/E nisbati (TTM) narxning foydaga nisbatini (oxirgi o'n ikki oy uchun) anglatadi. Bu kompaniyaning o'tmishdagi daromadliligini aks ettiruvchi, kompaniyaning ketma-ket oxirgi o'n ikki oydagi aksiya boshiga daromad (EPS) asosida hisoblangan tarixiy baholash ko'rsatkichidir.
P/E nisbati aksiya narxi va kompaniya daromadliligi o'rtasidagi nisbatni o'lchaydi va ko'pincha aksiya "arzon" yoki "qimmat" ekanligini baholash uchun mezon sifatida ishlatiladi.
P/E nisbati = bozor narxi (P) ÷ aksiya boshiga daromad (EPS), yoki P/E nisbati = umumiy bozor kapitallashuvi ÷ aksiyadorlarga tegishli sof foyda
P/E nisbatini (TTM) talqin qilish har doim boshqa omillar bilan birgalikda ko'rib chiqilishi kerak; u asosan mustaqil ko'rsatkich sifatida emas, balki qiymatni qiyosiy baholash uchun ishlatiladi.
- Past P/E (TTM) koeffitsiyenti investorlar har bir foyda birligi uchun kamroq to'lashlarini anglatadi. Bu aksiyalar past baholanganligini yoki bozor kompaniyaning kelajakdagi o'sishi bo'yicha cheklangan kutilmalarga ega ekanligini ko'rsatishi mumkin, masalan, rivojlangan yoki sekin rivojlanayotgan sohalarda.
- Yuqori P/E (TTM) nisbati investorlar har bir foyda birligi uchun ko'proq to'lashlarini anglatadi. Bu ko'pincha texnologik kompaniyalar aksiyalarining o'sishiga xos bo'lgan kelajakdagi foydaning sezilarli o'sishini kutishni aks ettiradi, ammo bu ularning haddan tashqari yuqori baholanayotganini ham ko'rsatishi mumkin.
- Analoglar bilan taqqoslash: kompaniyaning P/E (TTM) nisbatini xuddi shu sohadagi boshqa kompaniyalarning o'rtacha yoki mediana P/E qiymati bilan solishtiring. Nisbatan yuqoriroq P/E nisbati kompaniyaning yuqori baholanishi o'sishning kuchli istiqbollari yoki raqobatdosh ustunliklar bilan oqlanishini aniqlash uchun qo'shimcha tahlilni talab qilishi mumkin.
- Tarixiy darajalar bilan taqqoslash: kompaniyaning joriy P/E (TTM) nisbatini tarixiy o'rtacha ko'rsatkich (masalan, so'nggi 5 yoki 10 yil uchun) bilan taqqoslang, joriy baholash tarixiy maksimum yoki minimumda ekanligini baholang.
- Kengroq bozor bilan taqqoslash: bozor kompaniyani qanday baholashini ko'rish uchun kompaniyaning P/E (TTM) nisbatini asosiy bozor indekslari (masalan, S&P 500) bilan taqqoslang.
P/E nisbatlari (narx/foyda) turli sohalarda sezilarli darajada farq qilishi mumkin va P/E ning yagona "ideal" darajasi mavjud emas. O'rtacha P/E diapazoni sanoatga, kompaniyaning o'sish salohiyatiga va kengroq makroiqtisodiy muhitga bog'liq. Investitsiya qarorlari faqat P/E nisbatiga (TTM) tayanmasligi kerak, balki kompaniya sifati, o'sish istiqbollari va moliyaviy sog'lomlikni o'z ichiga olgan keng qamrovli tahlilga asoslanishi kerak.
Bitgetda aksiyalar bilan savdo qila olamanmi?
Siz Bitgetda aksiyalar bilan savdo qilishingiz mumkin, lekin an'anaviy aksiyalarni to'g'ridan-to'g'ri sotib olish yoki sotish orqali emas, balki asosan aksiya tokenlari va aksiya fyucherslari orqali.
Ushbu yondashuv Bitgetning an'anaviy moliya bozorlari va kriptovalyuta bozorlarini birlashtirishga qaratilgan universal birja (UEX) sifatida tasavvurini aks ettiradi.
Bitget hozirda quyidagi aksiyalar bilan bog'liq savdo formatlarini taklif etadi:
1. Aksiya tokenlari (spot)
Mohiyati: aksiya tokenlari ma'lum bir an'anaviy aksiyalar narxiga bog'langan raqamli tokenlardir (masalan, TSLAUSDT va NVDAUSDT) va Bitget spot bozorida savdo qilinadi.
Xususiyatlari: aksiya tokenlari bilan savdo qilishda siz asosiy an'anaviy aksiyalarga ega bo'lmay, tokenlarni sotib olasiz va saqlaysiz.
- Ushbu tokenlarning narxi odatda Tesla yoki Nvidia kabi ular bog'langan aksiyalarning narx harakatlariga mos keladi.
- Uning afzalligi shundaki, siz an'anaviy brokerlik hisobini ochmasdan, kriptovalyutalar (masalan, USDT) yordamida AQSH aksiyalari kabi an'anaviy moliyaviy aktivlarning narx harakatlarida ishtirok etishingiz mumkin.
2. Aksiya fyucherslari
Mohiyat: Bitget, shuningdek, Tesla va Meta kabi AQSHning asosiy "moviy fishkalar" aksiyalari asosida odatda aksiya fyucherslari deb ataladigan USDT marjasi bilan muddatsiz fyucherslarni taklif etadi.
Xususiyatlari: aksiya fyucherslari derivativlar bo'lib, ular sizga marja savdosi orqali asosiy aksiyaning kelajakdagi narxiga nisbatan o'suvchi yoki pasayuvchi pozitsiyasini ochish imkonini beradi. Ushbu mahsulotlar odatda 25x gacha bo'lgan kredit yelkasini qo'llab-quvvatlaydi.
Bu asosiy aksiyalarga egalik qilishni anglatmaydi. Buning o'rniga, foyda va zararlar fyucherslarning narx harakatlari asosida hal qilinadi.
Muhim eslatma: Bitgetda aksiya fyucherslari savdosida siz kriptovalyuta ekotizimi doirasida derivativlar bozorlarida ishtirok etasiz. Bu an'anaviy broker orqali ommaviy sotiladigan aksiyalarni sotib olishdan tubdan farq qiladi, chunki siz asosiy kompaniyaning aksiyasiga egalik qilmaysiz.
Fyucherslar savdosi va kredit yelkasidan foydalanish yuqori xavf bilan bog'liq. Savdo qilishdan oldin xavflarni to'liq tushunib yetganingizga ishonch hosil qiling.
Agar siz an'anaviy kompaniyalarning aksiyalariga to'g'ridan-to'g'ri egalik qilishni va aksiyadorlarning huquqlaridan foydalanishni (masalan, dividendlar olishni) istasangiz, tartibga solinadigan an'anaviy broker yoki brokerlik platformasi xizmatlaridan foydalanishingiz kerak.
Bitget aksiya fyucherslarining afzalliklari nimada?
Bitget aksiya fyucherslari (odatda, aksiya tokeni narxiga asoslangan muddatsiz fyucherslar) innovatsion taklif bo'lib, kripto-platformalariga an'anaviy moliya bozorlariga kirish imkonini beradi.
An'anaviy aksiyalar yoki fyucherslar savdosi bilan taqqoslaganda, ular asosan platformaning savdo infratuzilmasi tufayli bir qator noyob afzalliklarni taklif etadi.
Bitget aksiyalari, odatda USDT bilan ifodalangan derivativlar, quyidagi asosiy afzalliklarni taklif etadi:
1. Savdo qulayligi va global kirish imkoniyati
- 24/7 savdo: AQSH qimmatli qog'ozlar bozorlari kabi an'anaviy fond bozorlari belgilangan savdo soatlarida ishlaydi. Bundan farqli o'laroq, kriptovalyuta derivativlari bozorlari odatda 24/7 ochiq bo'ladi. Bu shuni anglatadiki, investorlar shoshilinch yangiliklar yoki bozor tebranishlari fonida yuzaga keladigan imkoniyatlardan foydalanib, istalgan vaqtda savdo qilishlari mumkin.
- Kirish uchun pastroq to'siqlar va tezroq ro'yxatdan o'tish: ko'pincha kengaytirilgan shaxsni tasdiqlash va uzoq muddatli hisob ochish jarayonini talab qiladigan an'anaviy brokerlar bilan solishtirganda, Bitget odatda tezroq hisobni ro'yxatdan o'tkazish imkoniyatini taqdim etadi. Foydalanuvchilar USDT kabi kriptovalyutalardan foydalanib, fiat mablag'larni kiritish va yechib olishning murakkab jarayonlariga ehtiyoj sezmasdan savdo qilishlari mumkin.
- Dunyo bo'ylab mavjudlik: foydalanuvchilar amaldagi me'yoriy talablarni hisobga olgan holda Bitget platformasi orqali xalqaro miqyosda tan olingan aksiyalar bilan bog'liq derivativlar savdosiga kirish imkoniyatiga ega bo'ladilar.
2. Kapital samaradorligi va yuqori kredit yelkasi
- Yuqori kredit yelkali opsionlar: aksiya fyucherslari odatda an'anaviy aksiya savdosiga qaraganda yuqoriroq (masalan, 25x gacha) kredit yelkasini taklif qiladi. Bu treyderlarga kichikroq marja talablari bilan kattaroq pozitsiyalarni boshqarish imkonini beradi va kapital samaradorligini oshiradi.
Izoh: garchi yuqori kredit yelkasi foydani oshirishi mumkin bo'lsa-da, u mutanosib ravishda zararni ham oshiradi. - Ikki tomonlama savdo: treyderlar ham long, ham short pozitsiyalarni osonlik bilan ochishlari mumkin. Bu shuni anglatadiki, treyderlar bozor yo'nalishini to'g'ri prognoz qilish orqali aksiyalar narxining o'sishi yoki pasayishi sharoitida bozor o'zgaruvchanligidan foyda olishlari mumkin.
3. Kriptovalyuta yordamida savdo qilish va hisob-kitob qilish
- USDT marjasi: Bitget aksiya fyucherslari odatda marja va hisob-kitob valyutasi sifatida USDT (yoki boshqa steyblkoinlar) dan foydalanadi. Kriptovalyutaga ega bo'lgan foydalanuvchilarga aktivlarni fiatga aylantirishning hojati yo'q, bu ularga to'g'ridan-to'g'ri steyblkoinlar yordamida savdo qilish imkonini beradi.
- Samarali mablag' o'tkazmalari: Kriptovalyutalar asosidagi o'tkazmalar va hisob-kitoblar odatda an'anaviy fiat tizimlariga qaraganda tezroq amalga oshiriladi, bu esa mablag'larni yanada samarali taqsimlash imkonini beradi.
4. Integratsiya
Yagona platforma: Bitget foydalanuvchilarga bir platformada spot, kriptovalyuta derivativlari va aksiya fyucherslari bilan savdo qilish imkonini beradi, bu esa turli xil aktivlarni bir joyda boshqarishni osonlashtiradi.
Bitget aksiya fyucherslari bir qator afzalliklarni taklif qilsa-da, ular bilan bog'liq xavflarni tushunish muhimdir.
- Yuqori kredit yelkasi xavfi: Kredit yelkasi bilan savdo qilish butun marjangizning tezda yo'qolishiga olib kelishi mumkin.
- Aksiyadorlik huquqi yo'q: Aksiya fyucherslari bilan savdo qilishda siz asosiy aksiyalarga egalik qilmaysiz. Natijada, siz dividendlar yoki ovoz berish huquqiga ega emassiz.
- Bozordagi likvidlik xavfi: Aksiya token fyucherslari an'anaviy fond bozorlaridagi muqobillariga qaraganda, ayniqsa odatiy savdo soatlaridan tashqarida, pastroq likvidlikka ega bo'lishi mumkin.
Umuman olganda, Bitget aksiya fyucherslari quyidagi afzalliklarni taqdim etadi: savdo moslashuvchanligi, kirish to'siqlarining pastligi va yuqori kapital samaradorligi.
Bitget aksiya fyucherslari uchun savdo komissiyalari qancha?
Bitget aksiya fyucherslari uchun savdo komissiyalari (USDT marjali muddatsiz fyucherslar) asosan tranzaksiya komissiyalari va moliyalashtirish stavkalarini o'z ichiga oladi.
Tranzaksiya komissiyalari:
Bitget vaqti-vaqti bilan treyderlarni jalb qilish uchun aksiya fyucherslari (ayniqsa, aksiya tokenlari fyucherslari) uchun muddati cheklangan pasaytirilgan komissiyali promoaksiyalarini taklif qiladi.
Standart stavkalar: Bitget fyuchers komissiyalarining standart tuzilmasi doirasida, teyker komissiyasi odatda 0.06% atrofida, meyker komissiyasi esa 0.02% atrofida bo'ladi.
Aksiya fyucherslari bo'yicha joriy promoaksiyalar (muhim): Bitget aksiya fyucherslari bo'yicha o'z mahsulotlarini ilgari surish maqsadida 2025-yilning 4-choragi davomida tranzaksiya komissiyalariga chegirmalar taklif qilmoqda: teyker komissiyasi atigi 0.006% gacha, meyker komissiyasi esa 0.002% gacha. Shuningdek, spot aksiya tokenlari uchun komissiyasiz savdoni taklif qiluvchi muddati cheklangan promoaksiya ham mavjud.
Moliyalashtirish stavkasi:
Moliyalashtirish stavkasi muddatsiz fyucherslarda (shu jumladan aksiya fyucherslarida) asosiy mexanizm bo'lib, u fyuchers narxini asosiy aktivning spot narxiga yaqin ushlab turishga yordam beradi. Bu platforma tomonidan olinadigan komissiya emas, balki long va short pozitsiyali treyderlar o'rtasida amalga oshiriladigan davriy to'lovdir.
Moliyalashtirish stavkalari dinamik ravishda o'zgarib turadi va asosan bozor kayfiyati, hamda long va short pozitsiyalar o'rtasidagi nomutanosiblik bilan bog'liq. Aksiya fyucherslari, odatda, kriptovalyutalarga qaraganda pastroq o'zgaruvchanlik bilan ajralib turadi. Shuning uchun barqaror bozor sharoitlari davrida moliyalashtirish stavkalari ko'pincha nisbatan past bo'ladi. Biroq, moliyaviy natijalarni e'lon qilish davrida yoki muhim ijobiy yoki salbiy yangiliklar paydo bo'lganda, long yoki short pozitsiyalarning yuqori konsentratsiyasi (masalan, Tesla yoki Nvidia kabi tez o'sib borayotgan texnologik kompaniyalar aksiyalarida) moliyalashtirish stavkalarining qisqa muddatli o'sishiga olib keladigan sezilarli nomutanosiblikka olib kelishi mumkin.
Moliyalashtirish to'lovlari odatda har 8 soatda amalga oshiriladi. Agar siz moliyalashtirishni hisoblash vaqtidan oldin pozitsiyani yopsangiz, moliyalashtirish to'lovi olinmaydi va hisoblanmaydi.
Moliyalashtirish stavkalari qat'iy belgilanmagan. Agar pozitsiyani uzoq vaqt davomida ushlab tursangiz, yuqori ijobiy moliyalashtirish stavkalari (long pozitsiyalar uchun) yoki yuqori salbiy moliyalashtirish stavkalari (short pozitsiyalar uchun) pozitsiyani ushlab turish uchun umumiy xarajatlaringizga yoki potensial daromadingizga ta'sir qiladi. Shu sababli, savdo interfeysida moliyalashtirish stavkasini real vaqt rejimida kuzatib borish muhimdir.
Nima uchun Bitget aksiya fyucherslari bilan savdo qilish uchun ideal platforma?
Bitget o'zini an'anaviy moliya (TradFi) va kriptoekotizimni birlashtirgan holda yetakchi universal birja (UEX) sifatida ko'rsatadi. 2025-yil oxiri va 2026-yilga kelib, u foydalanuvchilarga kriptovalyuta vositalari yordamida aksiya derivativlari bilan savdo qilish imkonini beruvchi tokenlashtirilgan aksiya fyucherslarini taklif qilgan birinchi yirik markazlashtirilgan birjalardan biriga aylandi.
Quyidagi sabablarga ko'ra Bitget aksiya fyucherslari savdosi uchun ideal platforma hisoblanadi:
1. Yagona garov (USDT marja)
Eng katta afzalliklardan biri Tesla (TSLA), NVIDIA (NVDA) va Apple (AAPL) kabi AQSH aksiyalari bilan USDTni garov sifatida ishlatgan holda savdo qilish imkoniyatidir.
- Fiat konversiyasi yo'q: Global aksiyalar bilan savdo qilish uchun kripto ekotizimidan chiqishingiz yoki AQSH dollariga konvertatsiya qilishingiz shart emas.
- Aktivlar o'rtasidagi samaradorlik: Siz kripto va aksiya pozitsiyalaringizni bitta USDT-M fyucherslari hisobidan boshqarishingiz mumkin, bu esa kapitalni taqsimlashni osonlashtiradi.
2. Yuqori kapital samaradorligi
Bitget kredit yelkasining an'anaviy brokerlik platformalarida odatda mavjud bo'lmagan agressiv variantlarini taklif etadi:
- 25x gacha kredit yelkasi: An'anaviy birja brokerlari ko'pincha chakana savdogarlarni 2x yoki 4x kredit yelkasi bilan cheklasa, Bitget kapitaldan foydalanishning yuqori samaradorligini ta'minlaydi.
- Bo'lib-bo'lib savdo qilish: muddatsiz fyucherslar bo'yicha pozitsiyalarning moslashuvchan hajmi tufayli siz qimmat narxdagi aksiyalar (masalan, Meta yoki Amazon) bo'yicha pozitsiyalarni bitta aksiyaga to'liq kapitalga ehtiyoj sezmasdan ochishingiz mumkin.
Uzaytirilgan savdo soatlari (24/5)
An'anaviy fond bozorlari savdolarning ochilish vaqti bilan cheklangan bo'lib, dam olish kunlari yopiladi. Bitget aksiya fyucherslari mahsulotlari zamonaviy global treyderlar uchun mo'ljallangan:
- Uzluksiz kirish: Savdo odatda 24/5 (dushanbadan jumagacha, UTC+8) davom etadi, bu kripto bozorlarining moslashuvchanligini aks ettiradi.
- Makroiqtisodiy samaradorlik: agar yirik texnologiya kompaniyasi Nyu-York bozori yopilgandan so'ng foyda hisobotini e'lon qilsa, Bitget foydalanuvchilari ko'pincha aksiya tokenlari bozorlari orqali narx o'zgarishlariga darhol javob berishlari mumkin.
4. Raqobatbardosh komissiyalar tuzilishi
Bitget an'anaviy brokerlik platformalari modelini buzib, kam xarajatli yondashuvni taklif qiladi:
- Past komissiyalar: aksiya fyucherslari tranzaksiya komissiyalari ko'pincha 0.06% yoki undan pastroq bo'ladi, bu an'anaviy brokerlar bilan, kriptovalyutalar va TradFi platformasini birlashtirgan boshqa gibrid platformalar bilan solishtirganda juda raqobatbardosh ko'rsatkichdir.
- Yashirin komissiyalar yo'q: Keng spredlardan (buyurtma oqimi uchun to'lov) foyda oladigan ko'plab "nol komissiyali" brokerlardan farqli o'laroq, Bitget shaffof moliyalashtirish va marja modelidan foydalanadi.
5. Ilg'or savdo va nusxa savdosi
Bitget o'zining ijtimoiy savdo DNKsini fond bozoriga o'tkazadi:
- Aksiyalar uchun nusxa savdosi: Siz aksiya bozorlariga ixtisoslashgan elita treyderlariga obuna bo'lishingiz, ularning aksiya fyucherslari bo'yicha savdolarini avtomatik ravishda nusxalashingiz mumkin.
- SI asosidagi vositalar: platforma savdo operatsiyalarini amalga oshirish, xavflarni boshqarish va texnik tahlil qilishda yordam beradigan SI agentlarini o'z ichiga oladi.
Bitget birjasi foydalanuvchilar aktivlarini yanada ishonchli himoyalashni qanday ta'minlaydi?
Bitget foydalanuvchi aktivlarini himoya qilish uchun ko'p o'lchovli va shaffof himoya tizimini yaratdi, bu tizim markazlashtirilgan birjalarda (CEX) mavjud bo'lgan ishonch muammolarini hal qilish uchun maxsus ishlab chiqilgan.
Bitgetning aktivlarini himoya qilish bo'yicha beshta asosiy ustuni:
Bitgetda maxsus Himoya fondi mavjud bo'lib, u xakerlik hujumlari yoki xavfsizlik buzilishidan himoyaning so'nggi chizig'i bo'lib xizmat qiladi.
- Keng qamrov: 2026-yil boshiga kelib, fondning o'rtacha qiymati taxminan $600 millionni tashkil etadi (ilgari eng yuqori qiymati $750 milliondan oshgan edi).
- Aktivlarni diversifikatsiya qilish: Fond BTC va USDT kabi yuqori likvidli aktivlardan iborat bo'lib, bozor o'ta o'zgaruvchan bo'lgan sharoitida ham to'lov qobiliyatini ta'minlaydi.
- O'z-o'zini moliyalashtirish: Ushbu fond uchinchi tomon sug'urtasiga tayanmaydi. Bitget uni mustaqil ravishda moliyalashtiradi va kamida uch yil davomida mablag'larni yechib olishmasdan balansni $300 milliondan kam bo'lmagan darajada ushlab turish majburiyatini oladi.
Platforma foydalanuvchilar mablag'laridan noto'g'ri foydalanmayotganini ko'rsatish uchun Bitget muntazam zaxira hisobotlarini nashr etish uchun Merkl daraxti arxitekturasidan foydalanadi.
- Yuqori qamrov koeffitsiyenti: 2026-yil yanvar oyidagi ma'lumotlar shuni ko'rsatadiki, asosiy aktivlar (BTC, ETH, USDT, USDC) uchun o'rtacha zaxira koeffitsiyenti 163% ga yetdi, bu 1:1 ko'rsatkichidan sezilarli darajada oshadi.
- Mustaqil tekshiruv: foydalanuvchilar o'z aktivlarining anonim IDsi yordamida zaxira snapshotiga kiritilganligini tekshirish uchun platforma tomonidan taqdim etilgan ochiq kodli vositalardan foydalanishlari mumkin.
3. Sovuq/issiq hamyonlarni ajratish va multi-imzo
Asosiy texnik darajada, Bitget bank darajasidagi xavfsizlik arxitekturasidan foydalanadi:
- 95% oflayn saqlash: Foydalanuvchilar aktivlarining aksariyat qismi masofadan turib buzib kirishning oldini olish uchun internetdan butunlay izolyatsiya qilingan sovuq hamyonlarda saqlanadi.
- Ko'p imzoli (multi-sig): Muhim mablag' o'tkazmalari uchun bir nechta geografik jihatdan taqsimlangan va mustaqil kalit egalarining imzolari talab etiladi, bu esa bitta nosozlik nuqtasi xavfini bartaraf etadi.
4. Pul yechib olish bo'yicha qat'iy xavfsizlik siyosati
Shaxsiy hisoblarni buzib kirish xavfini kamaytirish uchun Bitget bir nechta himoya mexanizmlarini joriy etdi:
- Pul yechishning oq ro'yxatini bloklash: Yangi mablag' yechib olish manzilini qo'shgandan so'ng, hisob 24 soatlik pul yechib olishni muzlatish davriga kiradi.
- Qurilmalararo skanerlashni tasdiqlash: 2026-yilda ishga tushirilgan funksiya internetda boshlangan har qanday mablag' yechib olishni mobil ilova orqali QR-kodni skanerlash orqali tasdiqlashni talab qiladi, bu esa shaxsiy kompyuterda troyan dasturlari yordamida manzillarni o'zgartirishning samarali oldini oladi.
5. Muvofiqlik va xalqaro sertifikatlash
Bitget tartibga solish talablariga faol rioya qiladi va axborot xavfsizligi sohasida bir nechta xalqaro sertifikatlarni qo'lga kiritdi:
- ISO 27001 va ISO 27701: Bitget Axborot xavfsizligini boshqarish va Maxfiy axborotni boshqarish bo'yicha ikki tomonlama sertifikat oldi, bu uning ichki jarayonlari eng yuqori jahon muvofiqlik standartlariga muvofiqligini tasdiqlaydi.